Yesterday, I posted some brief thoughts on the recent Nasdaq correction:
Like the other two drops that we’ve had in the last year since the COVID crisis, even though the market took a quick dive it didn’t really mean much and is somewhat normal. This was the worst of the three recent dips in terms of relative strength but it didn’t even reach oversold levels:
And it barely registered on the VIX:
Like the other two drops, the TED spread stress indicator didn’t even budge. This is unlike what we saw for both drops in 2018 and especially COVID, suggesting further that the recent dip is more noise than any kind of real signal (thus far):
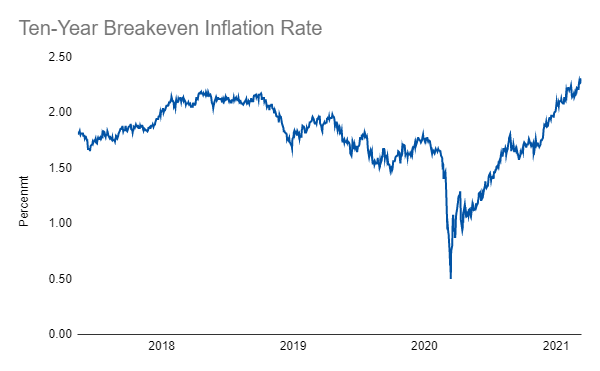
On the interest rate side, the furious comeback in inflation expectations points to a healthier economic picture (in my opinion). If we were seeing declining expectations, we could take another potential downturn seriously. We are far from that:
Furthermore, the yield curve continues to invert, which is exactly the kind of behavior we would expect to see in the early stages of a new economic cycle post recession trough:
Overall, we should expect market pullbacks even when general conditions are improving. It’s never a smooth ride. As of now, unless some new information or developments occur, the metrics for a continued recovery appear favorable. If I had to bet, it would be on more upside rather than downside, though that will forever be a tricky ask as to how exactly that will translate into market performance.
Links
Yesterday’s Post | Most Popular Posts | All Historical Posts | Contact
Portfolios
Main Portfolio | Wild Stuff | Shiny Stuff | Safe Stuff | Big Stuff | Random Stuff
Live Charts
Tracking Portfolio Performance | “Wild Stuff” Constituents | “Shiny Stuff” Constituents | “Safe Stuff” Constituents | Ten-Year Treasury Less Two-Year Treasury | Ten-Year Breakeven Inflation Rate | S&P 500 | S&P Rolling All-Time High | S&P 500 Drawdown | S&P 500 Rogue Wave Indicator | S&P 500 Moving Averages | S&P 500 / 200-Day Moving Average | S&P 500 / 50-Day Moving Average | S&P 500 50-Day Moving Average / 200-Day Moving Average | S&P 500 Relative Strength Index | CBOE Volatility Index (VIX) | Three-Month USD LIBOR | Three-Month Treasury Bill (Secondary Rate) | TED Spread | Price of Bitcoin | Bitcoin Rolling All-Time High | Bitcoin Drawdown | Bitcoin Rogue Wave Indicator | Nasdaq Composite Index | Nasdaq Composite All-Time High | Nasdaq Composite Drawdown | Nasdaq Composite Wave Indicator | Nasdaq Composite Moving Averages | Nasdaq Composite / 200-Day Moving Average | Nasdaq Composite / 50-Day Moving Average | Nasdaq Composite 50-Day Moving Average / 200-Day Moving Average | Nasdaq Composite Relative Strength Index


