
Analyzing a longer time period
Looking back further
In all of the simple cheat sheet analysis thus far, we have used the May 2013 to August 2020 time period. That’s because reliable Bitcoin data only goes back so far.
If we know that our eventual portfolio is only going to hold around 1-5% Bitcoin, we can remove it from the analysis to get a longer look back history. So, here is how our investments look with an additional six years of data going back to May 2007:
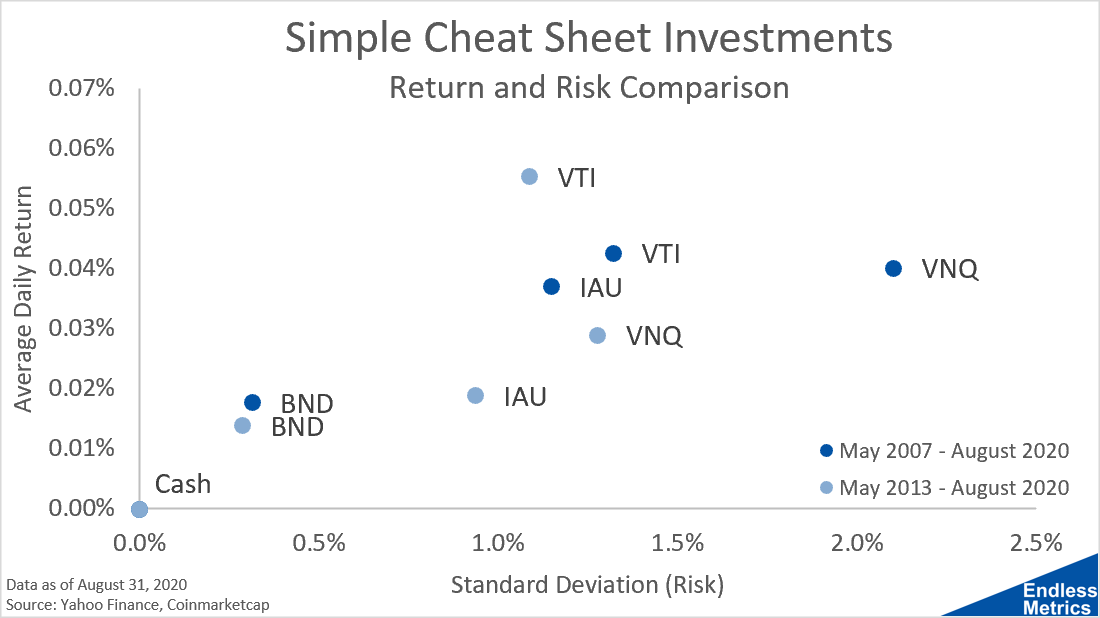
If you ask me, the Financial Crisis is a pretty important time period to capture. I’m not saying that another event like that is going to happen (though the coronavirus shock was a significant dip) but the more time we can cover and more business cycle behavior we can cover the better! We want to invest for the long-term so we should be analyzing a long-term history.
As far as the investments go, cash obviously doesn’t change. Money under the mattress is money under the mattress. Bonds are also surprisingly stable! Gold has better return with a few extra years but also has more volatility. And, real estate honestly looks even worse to me because that increase in volatility is massive (a housing bubble did pop after all).
The most notable change is stocks. While the other non-cash investments had some trade off of increased volatility but better returns, stocks are undeniably worse. They see a significant decrease in return along with an increase in volatility! That’s not good. It looks like we will need some more analysis before we can really determine a potential investment portfolio for ourselves.