Analyzing Japan's Stock Market Bubble
The Nikkei 225 vs GDP, M1, CPI, and Real Estate
Leading up to the end of the 1980s, the Japanese stock market was on fire:
Now, the chart above looks like a bubble but stocks tend to almost always look bubbly to a certain extent because that is the nature of stocks and charting price! So, we need to compare the index to some other indicators to see where the bubble started to get out of hand. Here’s GDP, a classic comparison:
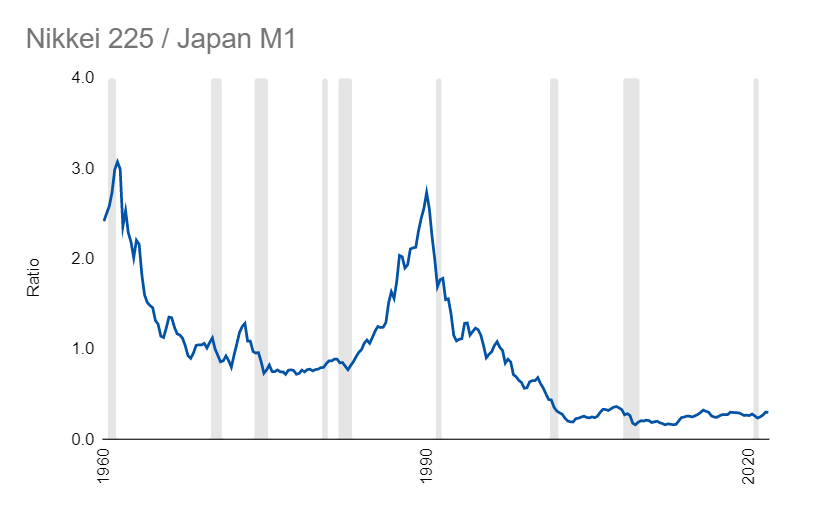
And M1 money supply:
Versus inflation:
And also versus real estate (which also was doing extremely well:
Basically, right after the U.S. had its recession that ended in 1980, the Nikkei took off. And, it ended just before the U.S. stock market began its own bubble in the 1990s for the dot-com era.
Links
Most Popular Posts | All Historical Posts | Main Site | EM100 | EM1000 | Contact


