
Benchmarks
It’s always good to double (or triple) check things
We’ve looked at fundamental data for our stock sample for days now, slicing and dicing the dataset to assess whether or not our approach is appropriate. But, there is one last sanity check we can do - test our dataset against other similar datasets.
This isn’t always possible in practice but, in this case, there are two we can use. Let’s start with Robert Shiller’s stock data:
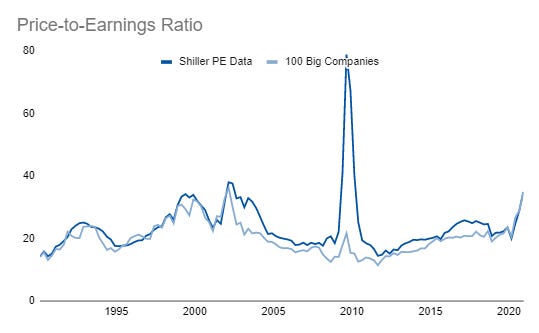
Obviously, the massive spike during the financial crisis sticks out. Shiller’s dataset shows a bigger loss of earnings during the crisis, spiking the ratio as earnings get closer to zero.
Another dataset takes two time series from FRED:
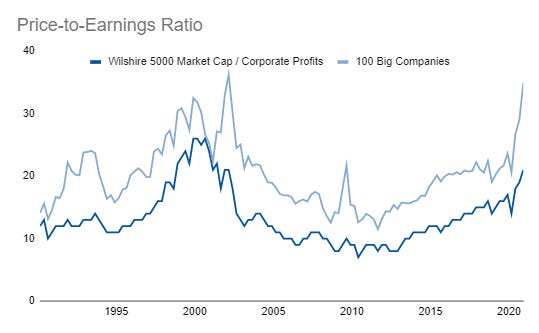
Here we see a similar picture but with a constant offset. This time series also doesn’t look like Shiller’s time series at all.
This is one of the problems with having multiple watches. When you have just one watch to tell you what time it is, you go with that time. If you have more than one watch and they are calibrated to different times, then what time is it? Now you have to check your phone and hopefully that confirms at least one watch!
Here, I’m not too worried about the differences. All three methodologies use approaches and get various results but tell the same general story.
There is no absolute perfect metric - they all have strengths and weaknesses. With our dataset, the most important strength is granularity. We have all of the underlying income statement and balance sheet information for all of these companies. We can calculate a ton of fascinating market metrics. We also know that, based on our previous analysis, these metrics are close to the “true” story in the market. With Shiller and FRED data all we get is the metric itself. That’s good for benchmarking and doing a sanity check but not much else.
So, that’s my interpretation. You may have a different one. You may not like that spike difference or the constant difference in the second dataset. You may use yet another data source. That’s where the “art” side of the analysis comes in. We’ve all got different tools to tell a story.
For now, I like this 100 stock sample! And, hopefully you’ve been convinced it’s reasonable. If not, I’ve got one last post to put the full story together in one big summary!