Bitcoin Price Metrics
Six charts based on price
Every so often I do a “price metrics” post on a particular investment. I love these posts because every single chart and metric comes from one thing - price! It’s amazing how many ways you can manipulate data to find new stories. For example, take moving averages:
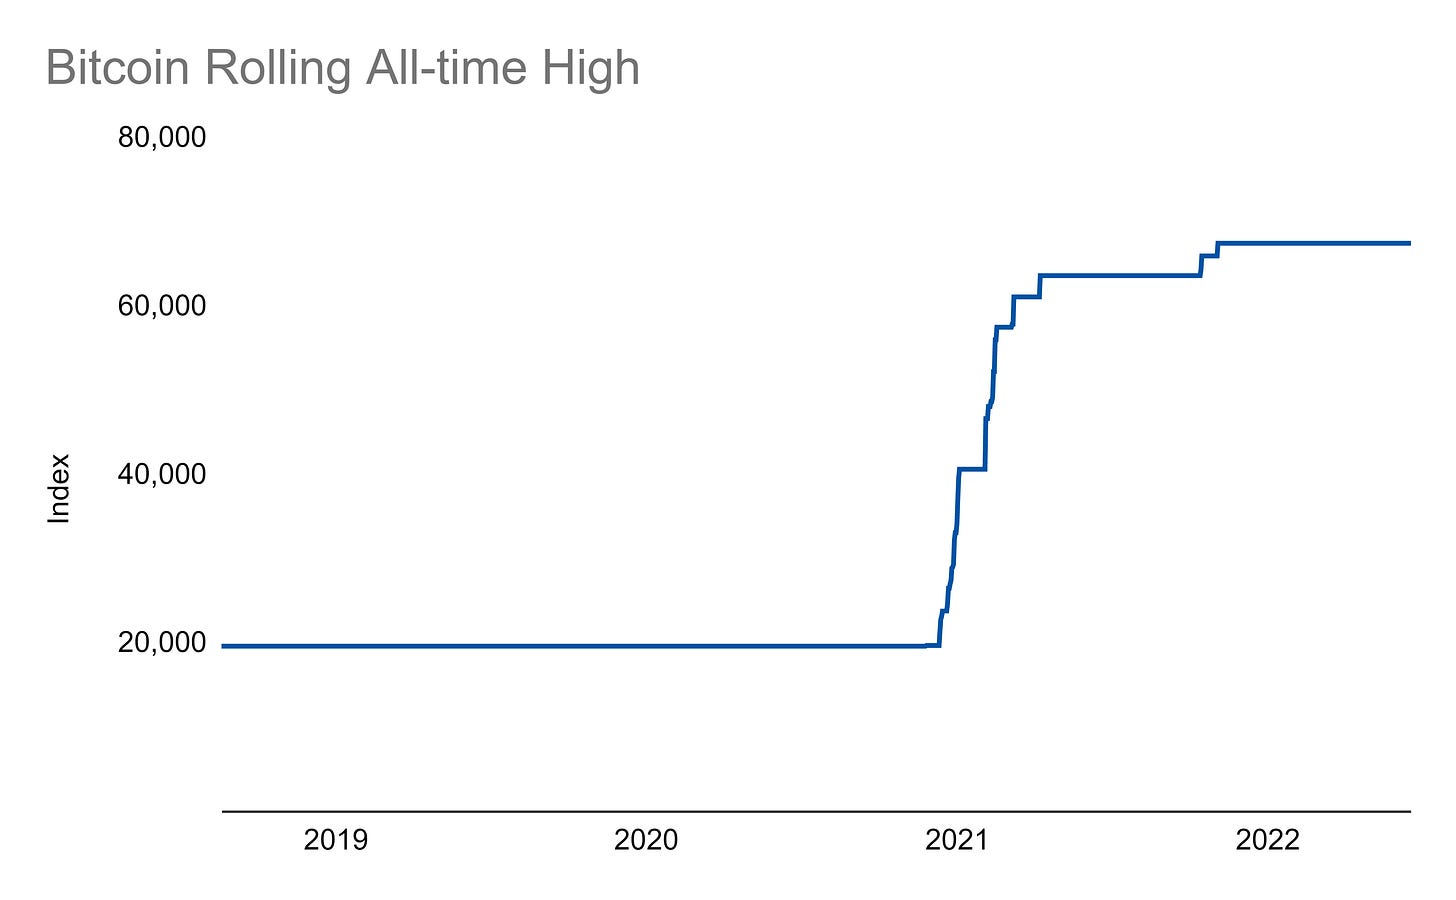
Bitcoins price is trailing both moving averages and is well below its all-time high:
It’s also so far down that it is almost comparable to the post 2017 crypto crash:
Since the ratio of moving averages is negative, that means we are still in post death cross territory:
Relative strength has trended down and is quite low:
Despite all this, volatility has been relatively subdued:
Unfortunately, for all the cool things there charts show us, they don’t show us where Bitcoin’s price will go next! For that, you’ll need a crystal ball.


