Comparing 10 big companies and 25 big companies
Does the sample size make that big of a difference?
The other day we looked at long-term PE ratios for ten big companies over thirty years. But there are many more companies with a long history that we can add to the group, so let’s look at what happens when we bump the sample size from 10 to 25.
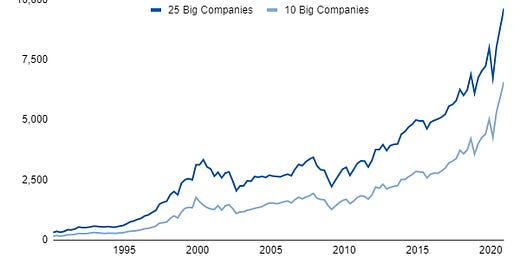
Starting with market capitalization, it’s bigger but surprisingly consistent in behavior:
Earnings has more variation with sharper drops and sharper peaks:
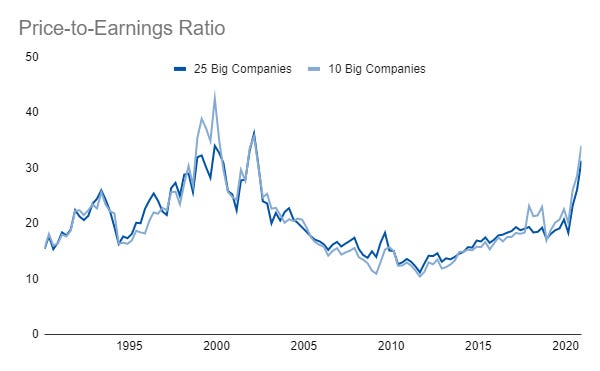
But, if we get to the PE ratio, we see the performance is almost identical:
Thus, while nominal values would obviously be expected to change, they don’t change in behavior as much as we might expect, just in level. And, when we standardize for the size of those nominal values by using the PE ratio, we end up with an extremely similar metric over the history. So, even with a bigger sample size we still get a very consistent story!
Links
Yesterday’s Post | Most Popular Posts | All Historical Posts | Main Site | Contact


