


Components of Household Assets
Breaking down what people own
When people think about what they own, they often think about assets. While actual net worth is calculated by taking assets less liabilities, for individuals who don’t have a huge amount of debt, assets are a pretty good approximation for wealth. So, it’s important to analyze the composition of household assets to better understand the primary drivers of wealth.
One simple way to classify underlying asset drivers is to label components as financial or non financial. The easiest example for a financial asset would be stocks. For non financial, real estate. Breaking those two components out as a percentage of total assets looks like this:
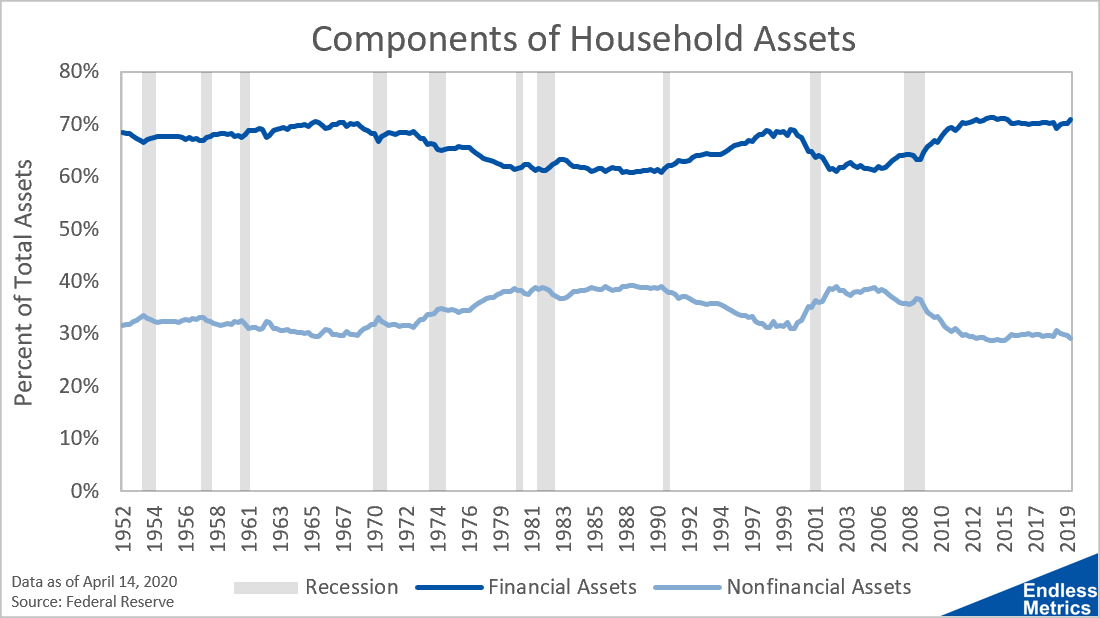
Sometimes, the relative boringness of a trend tells an interesting story. If we imagine a simple world where household balance sheets just have stocks (financial) and real estate (non financial), it would be easy to imagine some kind of meaningful change in concentration over seventy years. Stocks have a lot of volatility and real estate goes through periods of relative over and under valuation.
Despite all of the crazy changes that have happened in the world of finance and economics, the underlying contribution from financial and non financial assets has remained super stable. Each side has deviated within very small window. Over all this time, you can basically say household assets are 70% financial assets and 30% non financial assets and be really close to to reality, no matter the year.
If anything, knowing where the broader population as a whole stands offers a useful benchmark. If you have, for example, 90% of your worth in real estate, maybe some more diversification could be helpful. That’s a simple example that shows the rationale for looking at an endless amount of metrics - it helps us better reflect on our own choices and provides insights for better decisions going forward.