
Corporate Health Indicators
Are the corporations alright?
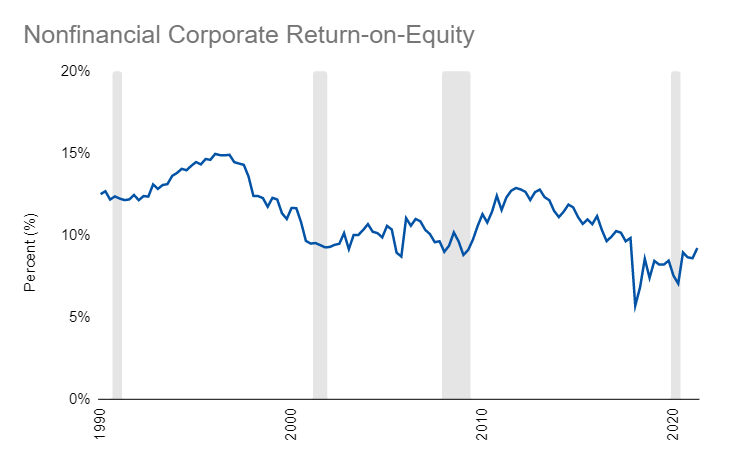
Companies make money and are actually pretty darn consistent at doing that:
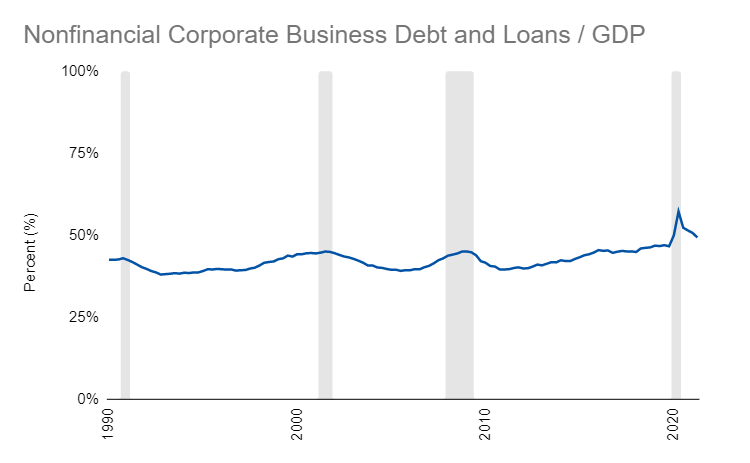
One indicator that gets some people upset though is how much debt they have. It is usually compared to GDP and the chart is scaled so it looks like it is increasing but if you use a simple 0-100% scale it honestly hasn’t changed that much:
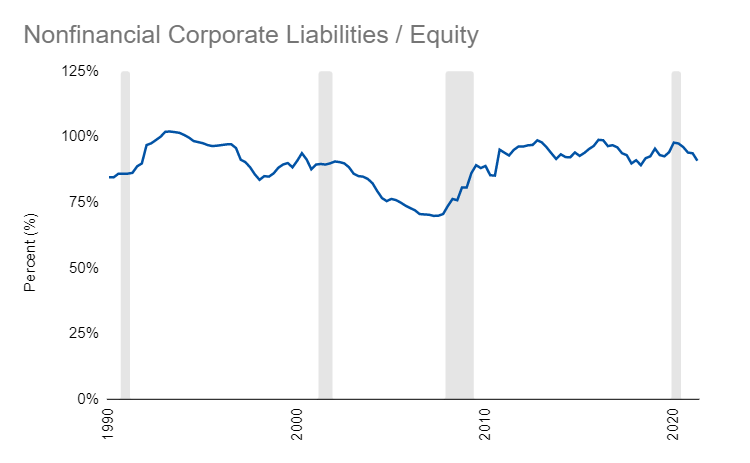
Looking at an internally-calculated leverage metric, we see that companies haven’t really increased in leverage significantly since the Financial Crisis (that’s good!):
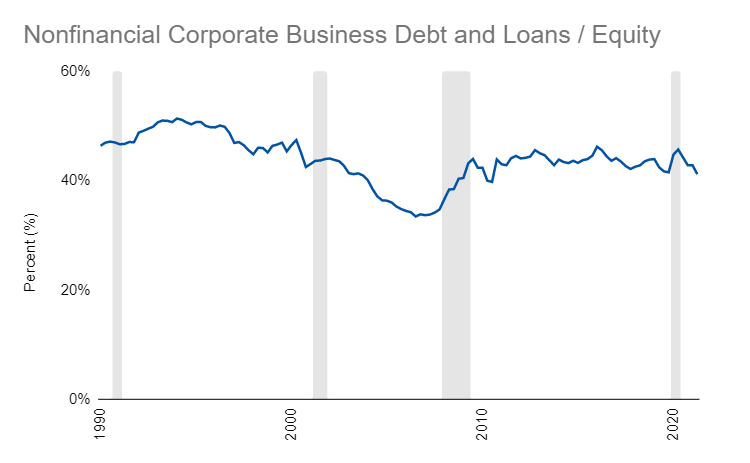
And, if we take the subset of debt and loan liabilities we see the same thing:
Further, if we use the market valuation of that equity as opposed to the accounting value, it looks even better for corporations:
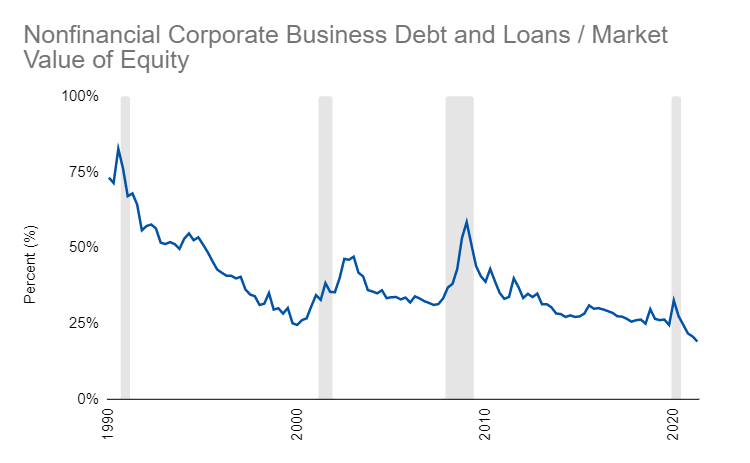
Overall, these kinds of metrics take a lot of nuance to understand and there is a lot more we need to do to really understand what is happening with a corporation. Perhaps, the lesson here is not a clear “yes” or “no to the question of whether companies are healthy but rather that one single chart won’t tell you that answer, despite what some a headline might claim in an article that uses it.
Links
Most Popular Posts | All Historical Posts | Main Site | EM100 | EM1000 | Contact