A classic profitability metric is return on assets (“ROA”), which simply divides net income by average total assets. This ratio allows us to easily compare companies of different sizes using a standardized approach to assess the volatility of earnings against the more stable behavior of assets on the balance sheet.
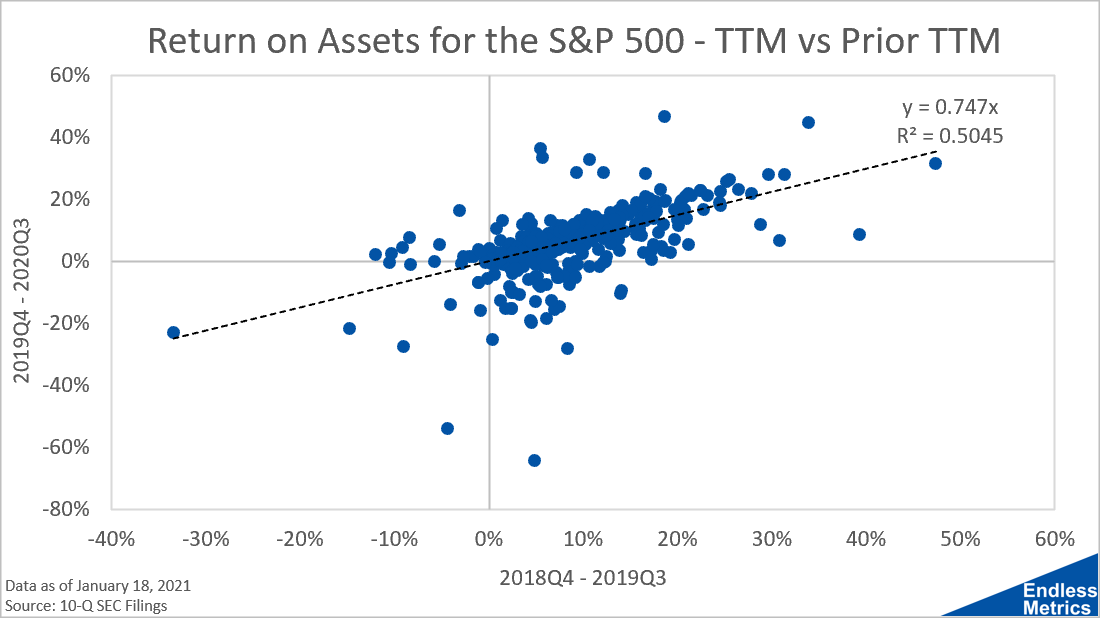
Analyzing the most recent complete set of quarterly filings from 2019Q4 to 2020Q3 and the year prior (2018Q4 to 2019Q3) for companies currently in the S&P 500, we get the following:
What we see in the scatter plot is that most companies that were profitable prior to COVID continued to be profitable during COVID. There was, however, a noticeable effect from the pandemic in terms of depressed earnings. On average, companies saw their ROA decrease to about 75% of levels seen in the year before the pandemic.
While there was an impact, it really wasn’t that big of one. Further, it’s unlikely that we will see another shock on the market from a subsequent infection wave as big as the first wave. Thus, we should expect profitability to continue to improve as time passes.
In this simple context then, the stock market may not be as frothy as it appears. The worst should be behind us and companies really didn’t even take that big of a hit. It’s a surprise, given the economic backdrop, but the market isn’t as concerned with the economy if companies keep making money. And, this crazy rally since March seems to confirm not only that but also optimism for the future - whether prudent or not.
Links
Yesterday’s Post | Most Popular Posts of All Time | All Historical Posts | Contact


