
Daily Valuation Metrics
Taking a more frequent look
One metric I’ve looked at a bunch is the P/E ratio. For example, here it is for Microsoft over the last thirty years:
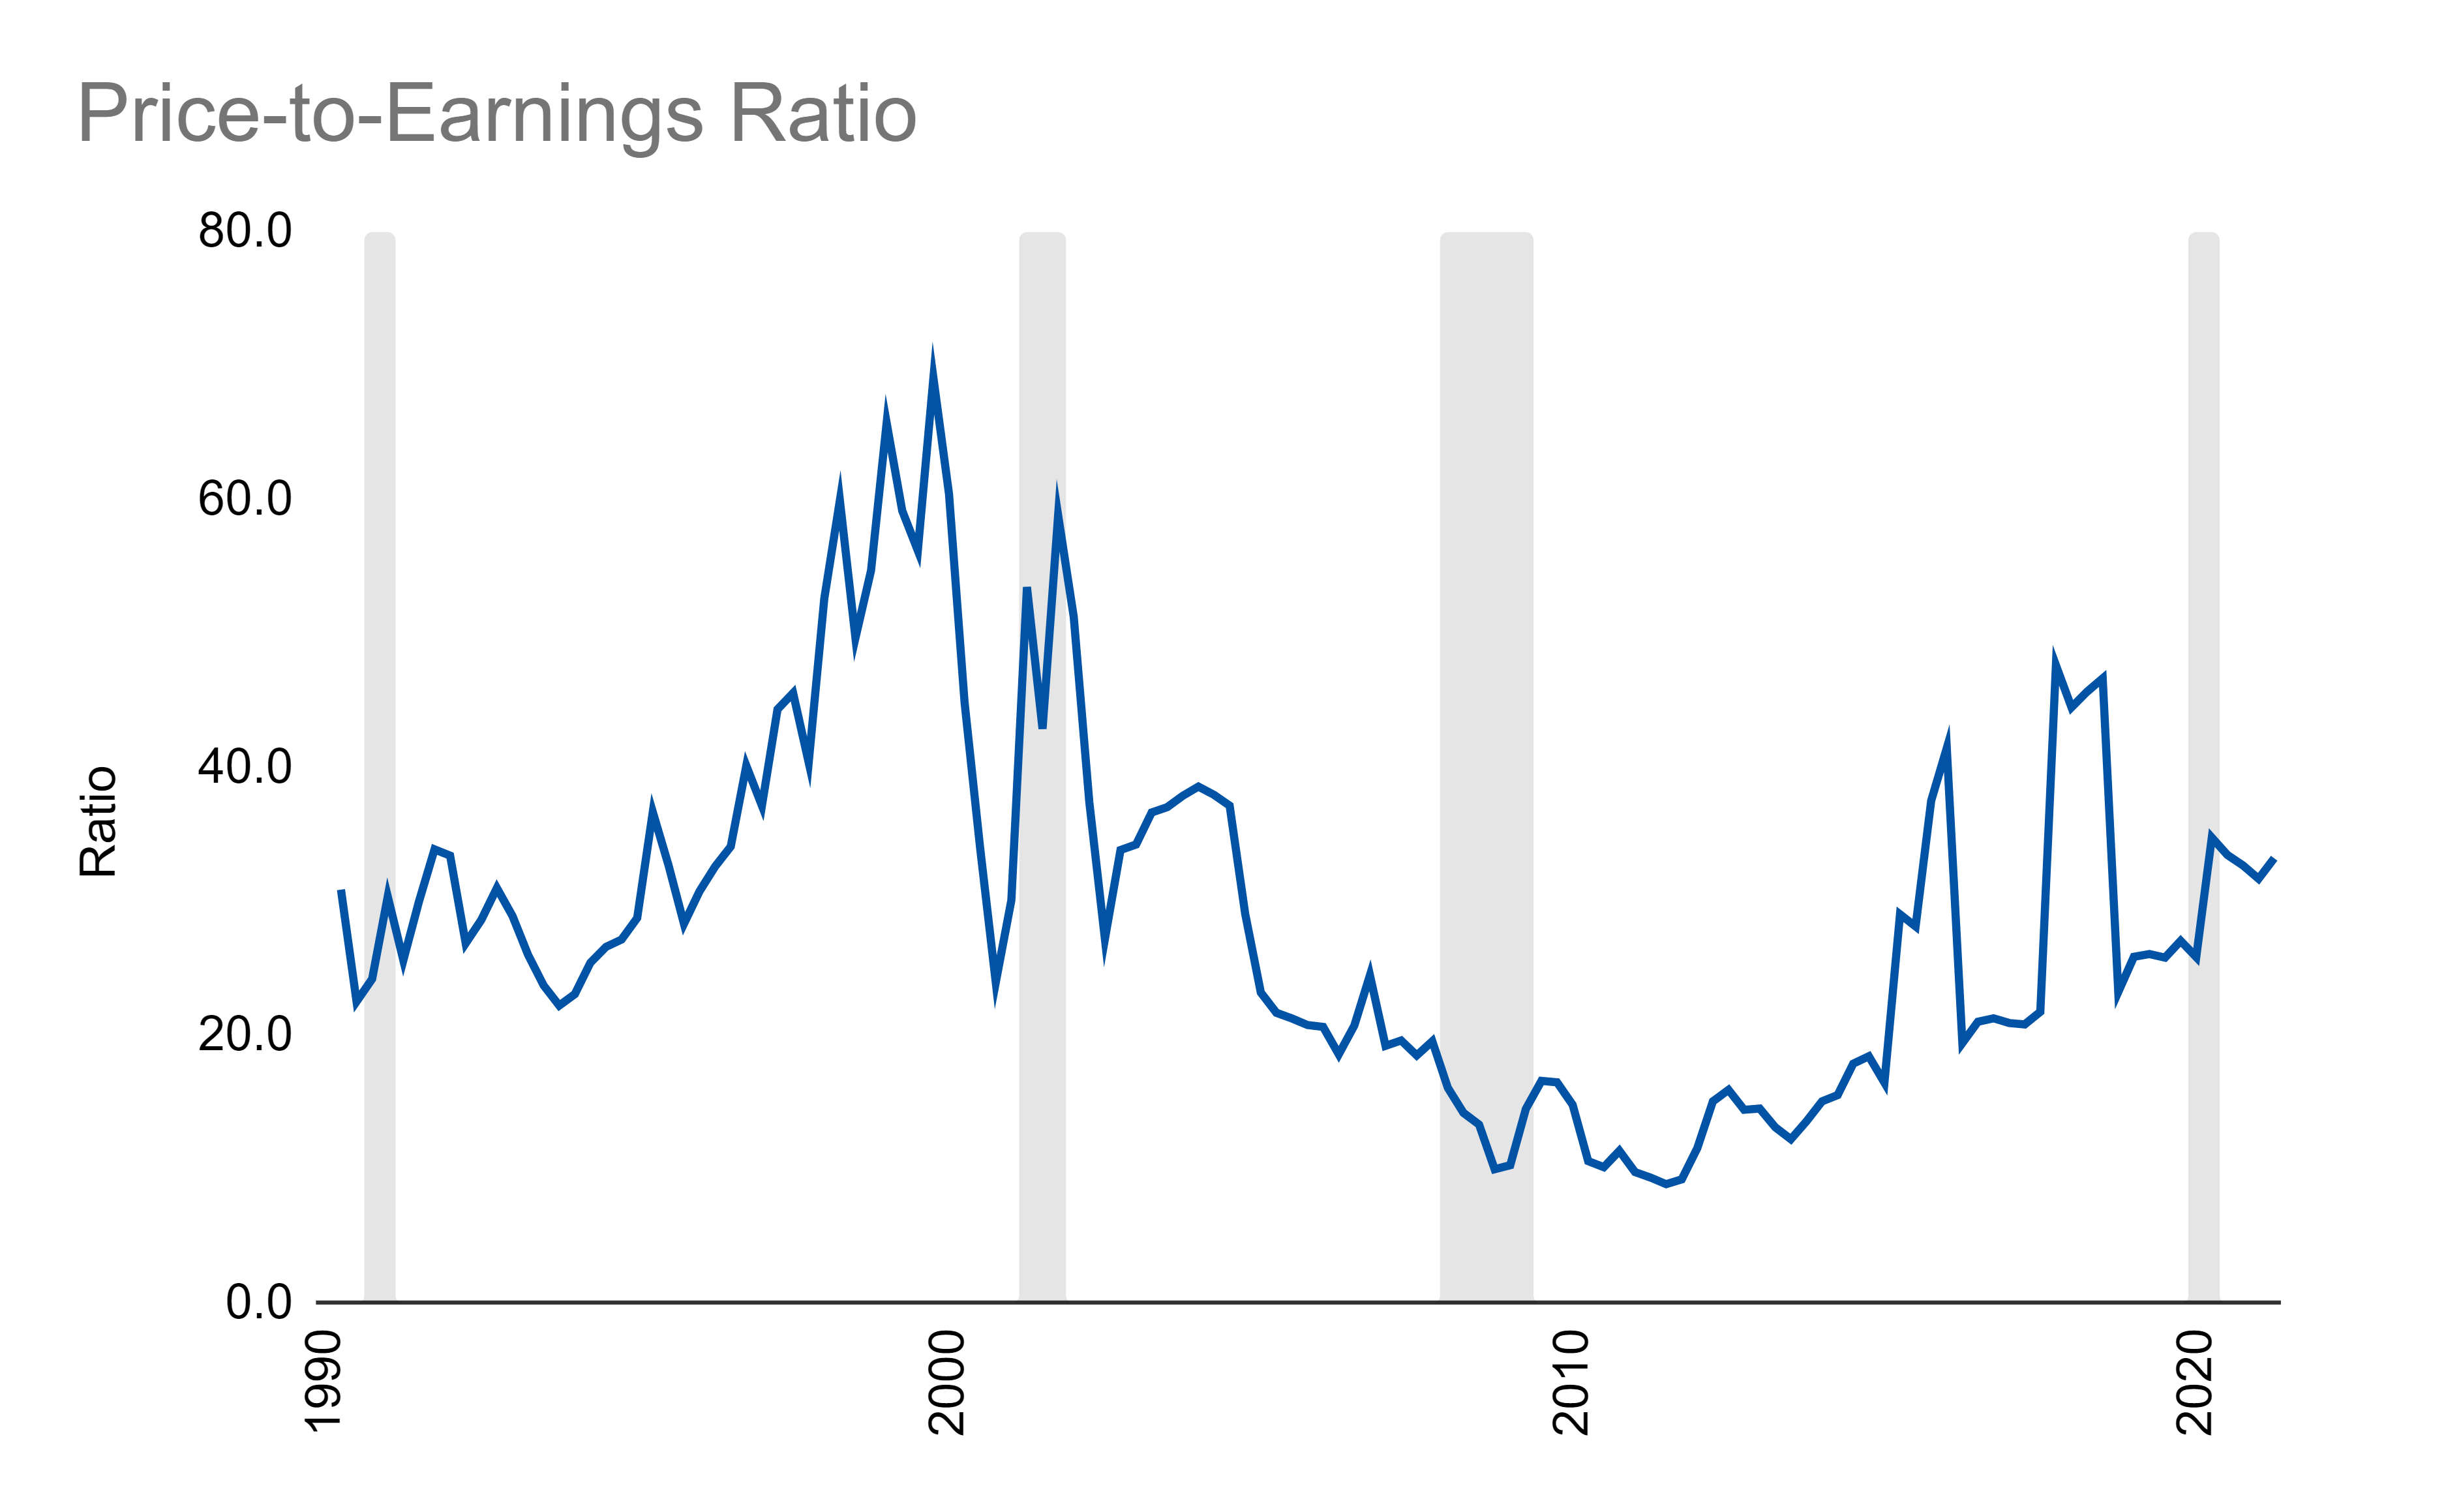
The thing about price though, is that it updates on almost a daily basis. Thus, we can update metrics that use it as an input at that same frequency. If we do that, here is what that chart looks like:
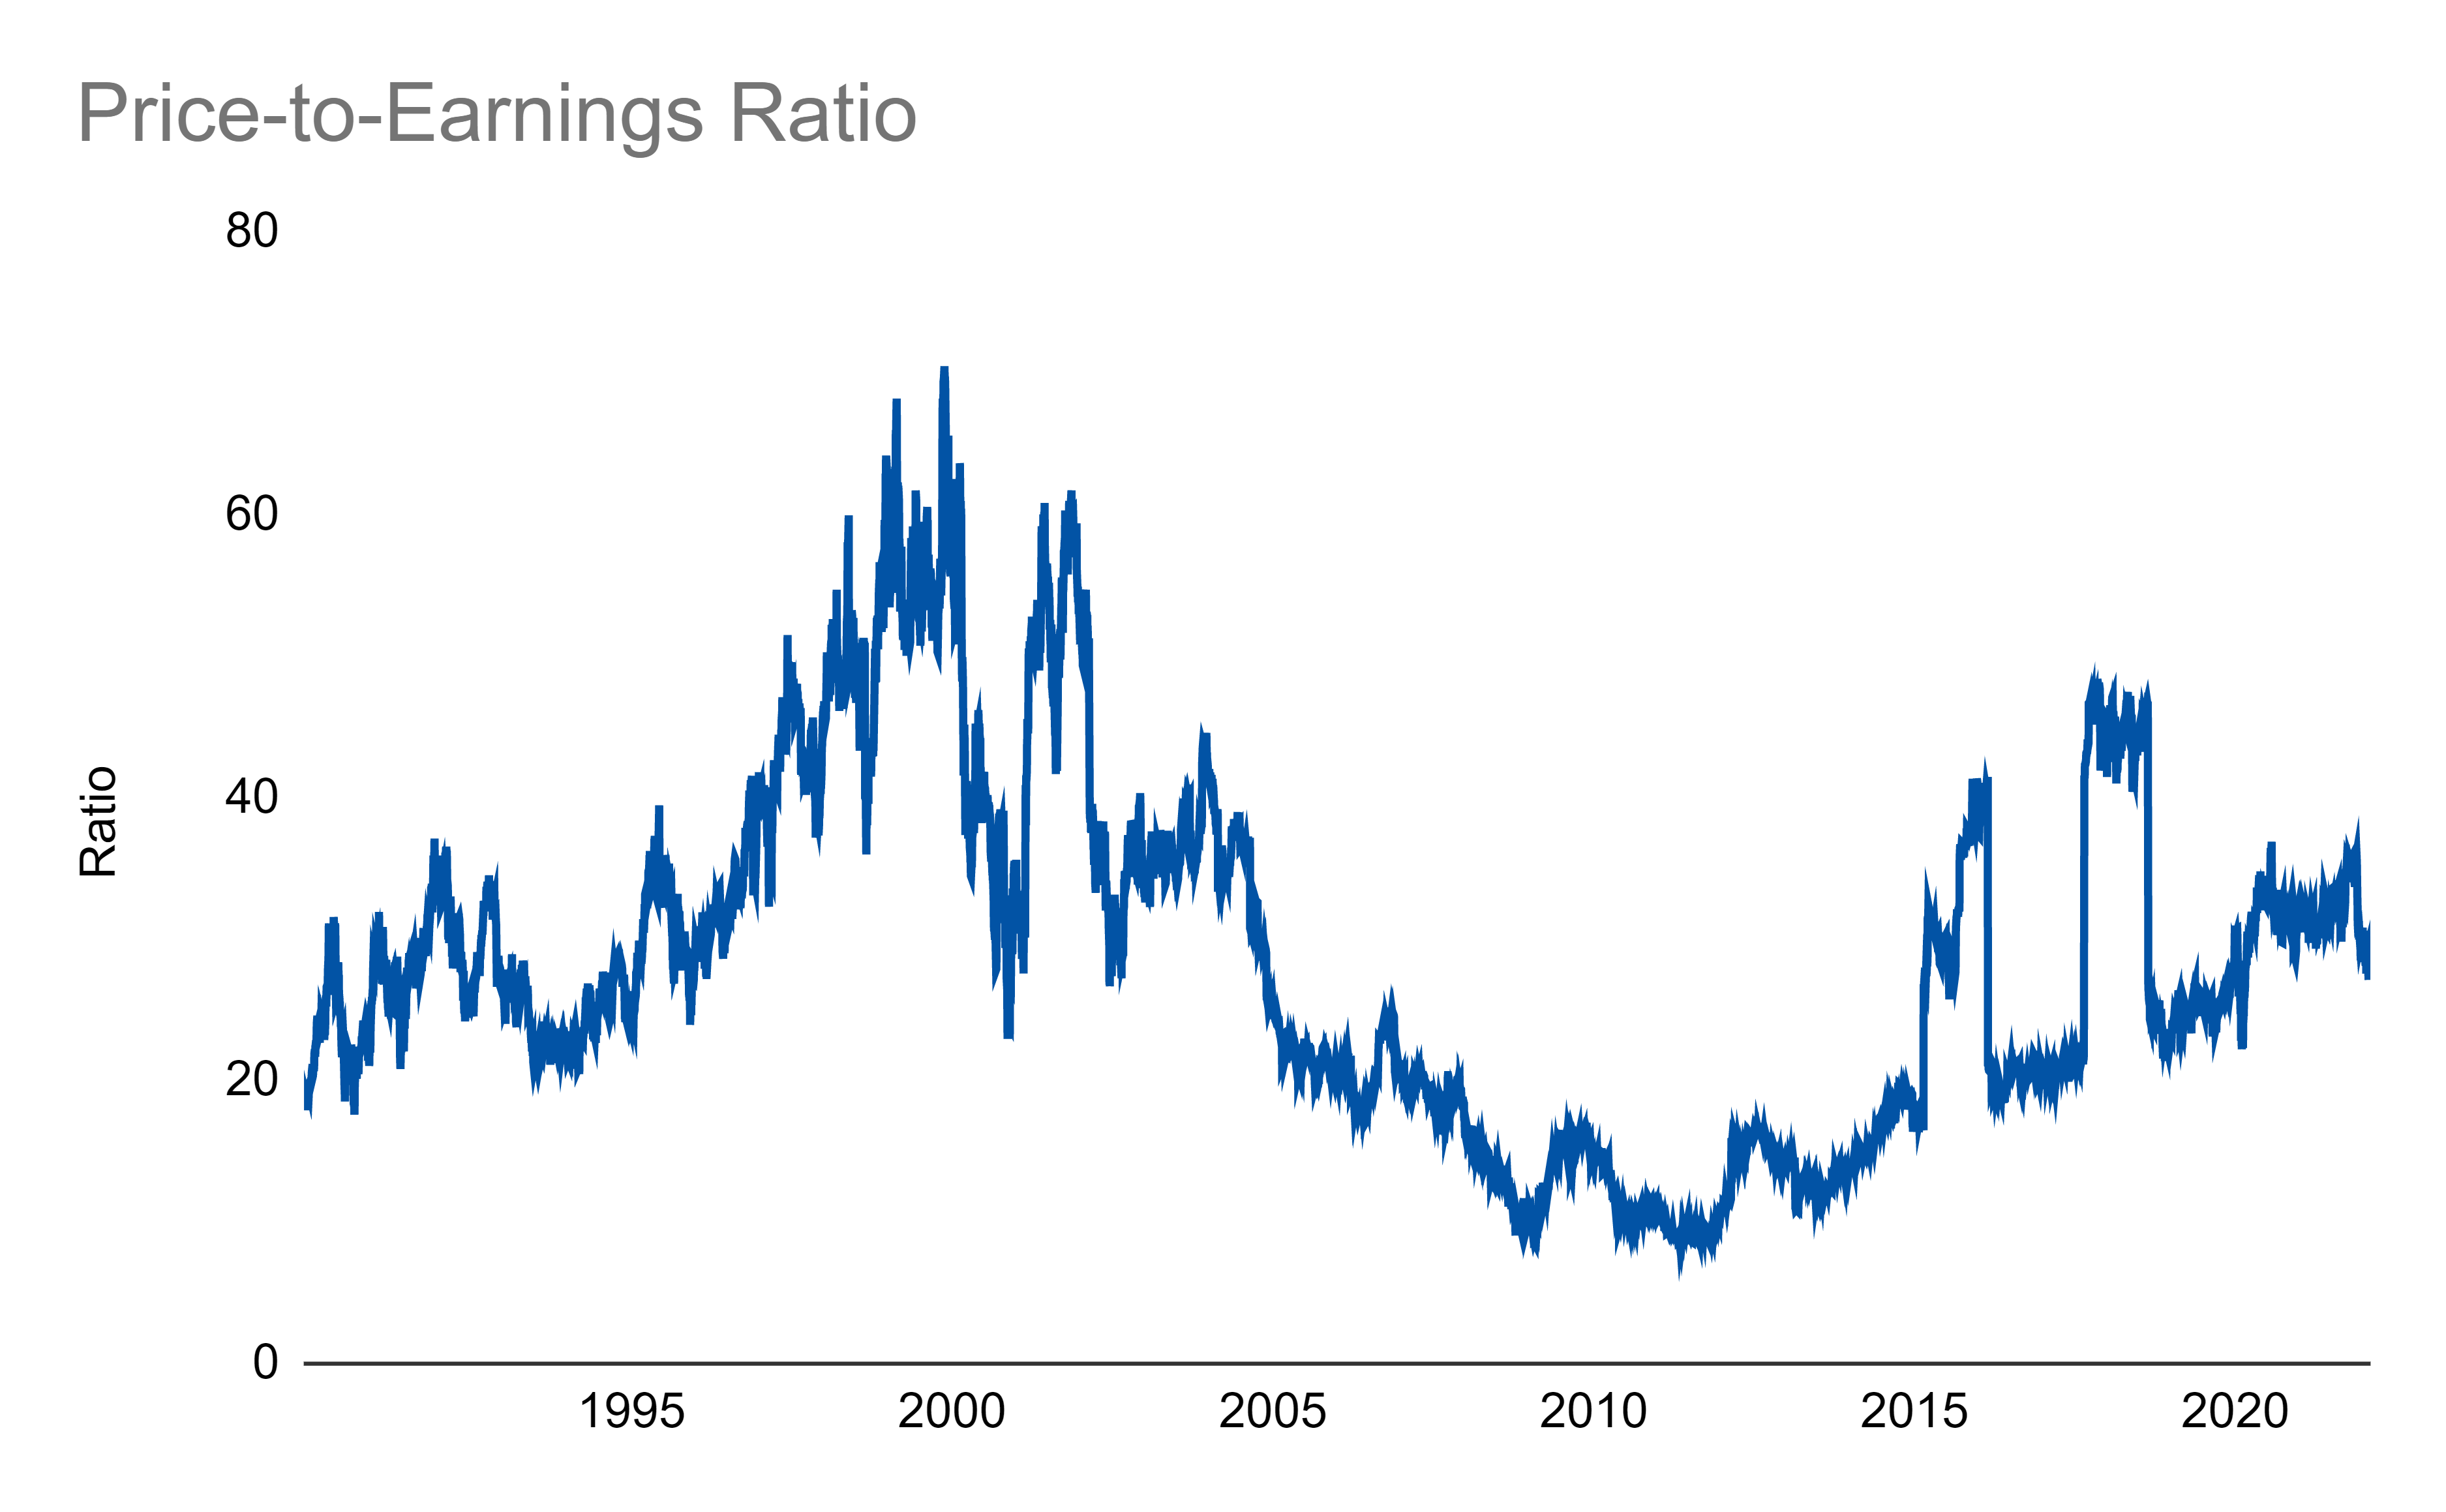
The surprising thing to me, is that these charts aren’t very different. So, on a historical basis for charting, it’s probably not really worth it to do all the extra daily calculations.
However, when it comes to day-to-day trading or finding price points for investment, it will definitely be worth it to us. After all, with the kinds of downturns that can happen between quarters, we could pick up some good deals and need to be ready to identify them!
Have a question you want to ask or a topic you’d like to see covered? Let me know!
Links
Most Popular Posts | All Historical Posts | Main Site | EM100 | EM1000