
Enterprise Value
After five days developing the daily stock template, I think it’s finally in a good spot. Let’s look at one more big company with the latest metrics, Facebook:
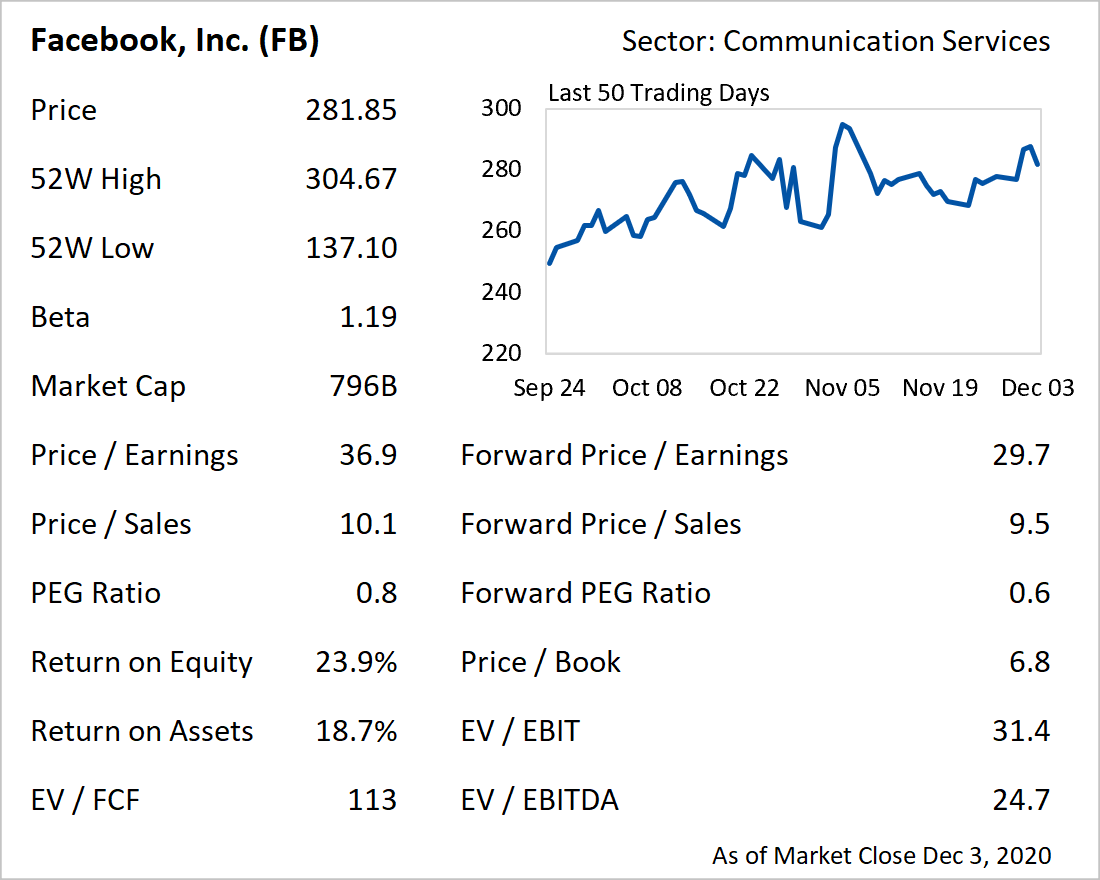
I added three new metrics, each of which uses enterprise value (“EV”) as the numerator. The most basic way to calculate EV is to take market capitalization, add debt, and substract cash. It’s used to measure the total cost of taking over a company (i.e. by buying all shares and debt).
Earnings before interest and tax (“EBIT”), earnings before interest, tax, depreciation, and amortization (“EBITDA”), and free cash flow (“FCF”) are different metrics to measure how much money a company is making. In Facebook’s case, EV / EBIT (31.4) and EV / EBITDA (24.7) are pretty close and not too far off from Price / Earnings (36.9), but EV / FCF (113) is much higher. These four metrics, which are supposed to be similar in a certain sense, produce very different results. That’s why it’s important to gather up lots of analysis to see what each piece of the puzzle is showing you about the “true” picture.
At this point, I’m pretty happy with the this daily stock cheat sheet. I think it’s time to get back to the typical newsletter format, which will now have this analysis added for a different stock each day! Over time, I’ll continue to make enhancements but it will probably be on a much more incremental basis. Hope this short series was helpful and will offer something extra to look forward to each day.
Long time follower first time commenter, thanks for the easy to follow and easily accessible newsletter!
I have a small suggestion (it might not be possible in the current format but just an idea): it would be very valuable if you you could give your train of thought about why, for exemple, these 4 metrics produce very different results and giving a bit more detailed explanations maybe.