
Five more cool charts for the Nasdaq
Moving averages and relative strength
Following up with the new stuff for the Nasdaq Composite Index from yesterday, we got five more awesome charts for the Nasdaq based on previously covered metrics:
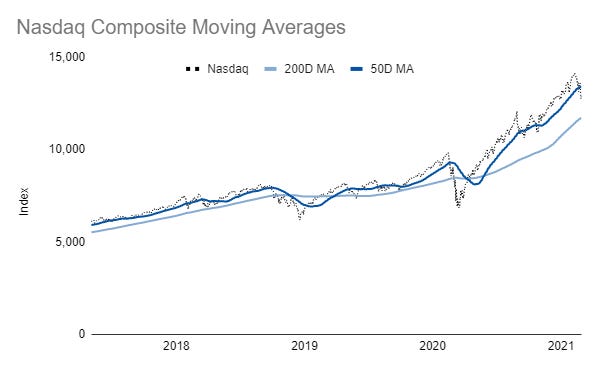
Nasdaq Composite Moving Averages
Nasdaq Composite / 200-Day Moving Average

Nasdaq Composite / 50-Day Moving Average

Nasdaq Composite 50-Day Moving Average / 200-Day Moving Average

Nasdaq Composite Relative Strength Index

Links
Yesterday’s Post | Most Popular Posts | All Historical Posts | Contact
Portfolios
Main Portfolio | Wild Stuff | Shiny Stuff | Safe Stuff | Big Stuff | Random Stuff
Live Charts
Tracking Portfolio Performance | “Wild Stuff” Constituents | “Shiny Stuff” Constituents | “Safe Stuff” Constituents | Ten-Year Treasury Less Two-Year Treasury | Ten-Year Breakeven Inflation Rate | S&P 500 | S&P Rolling All-Time High | S&P 500 Drawdown | S&P 500 Rogue Wave Indicator | S&P 500 Moving Averages | S&P 500 / 200-Day Moving Average | S&P 500 / 50-Day Moving Average | S&P 500 50-Day Moving Average / 200-Day Moving Average | S&P 500 Relative Strength Index | CBOE Volatility Index (VIX) | Three-Month USD LIBOR | Three-Month Treasury Bill (Secondary Rate) | TED Spread | Price of Bitcoin | Bitcoin Rolling All-Time High | Bitcoin Drawdown | Bitcoin Rogue Wave Indicator | Nasdaq Composite Index | Nasdaq Composite All-Time High | Nasdaq Composite Drawdown | Nasdaq Composite Wave Indicator | Nasdaq Composite Moving Averages | Nasdaq Composite / 200-Day Moving Average | Nasdaq Composite / 50-Day Moving Average | Nasdaq Composite 50-Day Moving Average / 200-Day Moving Average | Nasdaq Composite Relative Strength Index