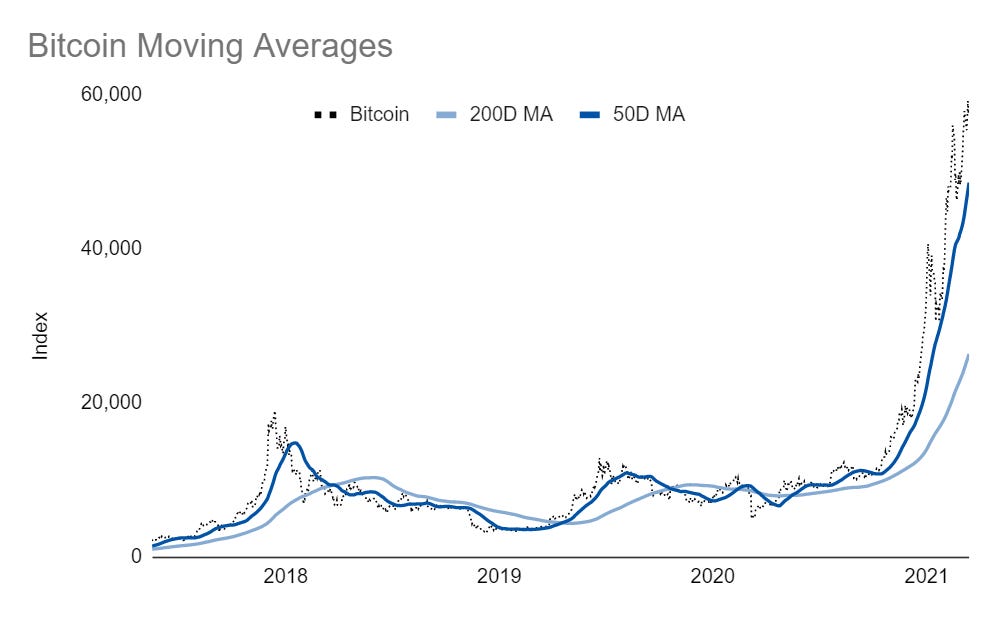
Since Bitcoin has some intense volatility and strange price behavior, moving averages add a little bit of sanity to the madness:
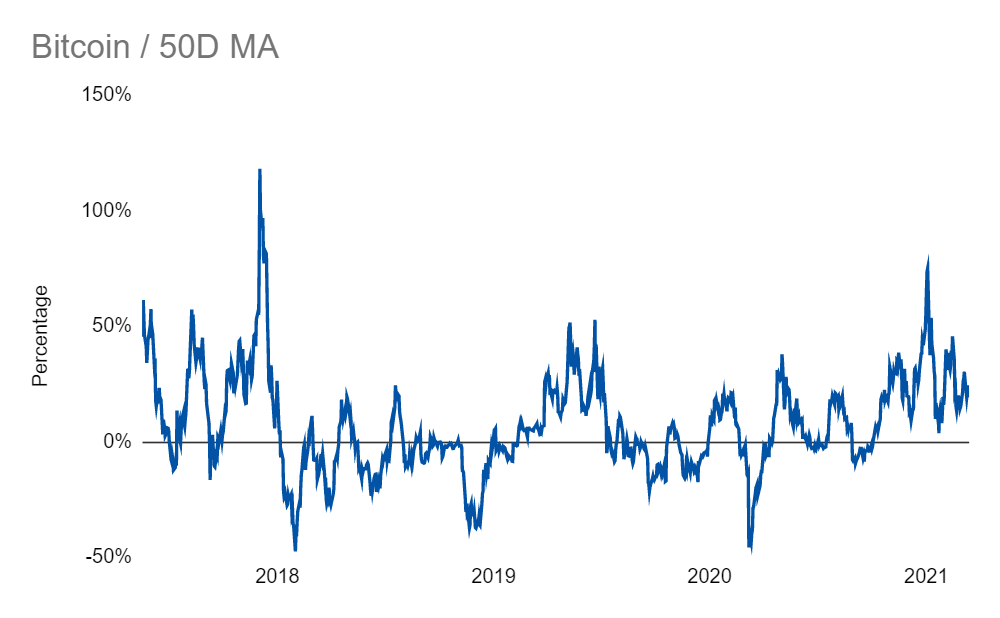
The price has also been running above the fifty-day moving average for a while now:
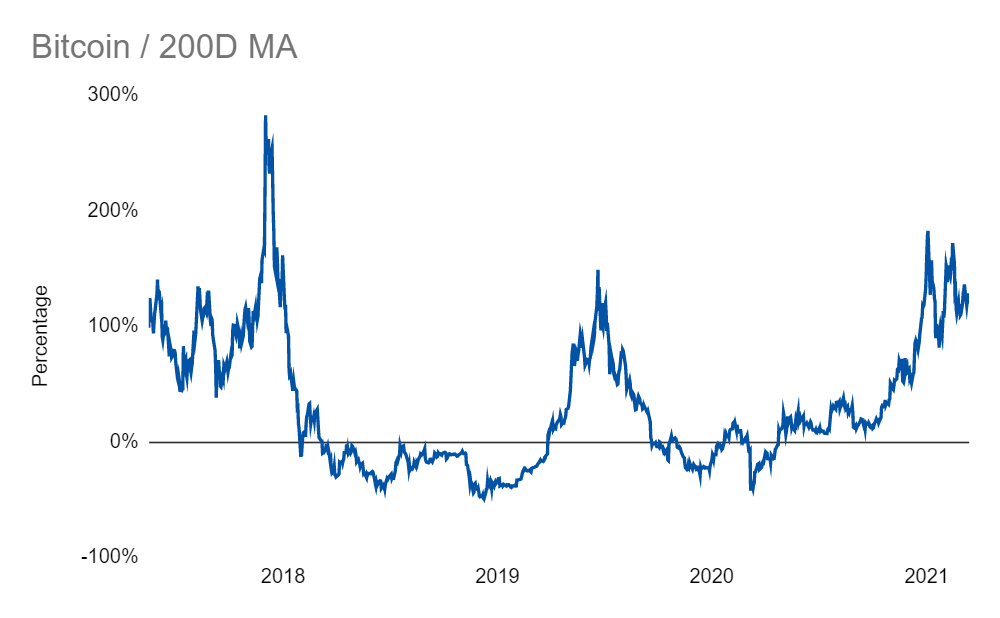
And the two-hundred-day moving average shows that we are still close to levels seen near the peak of the last two cycles:
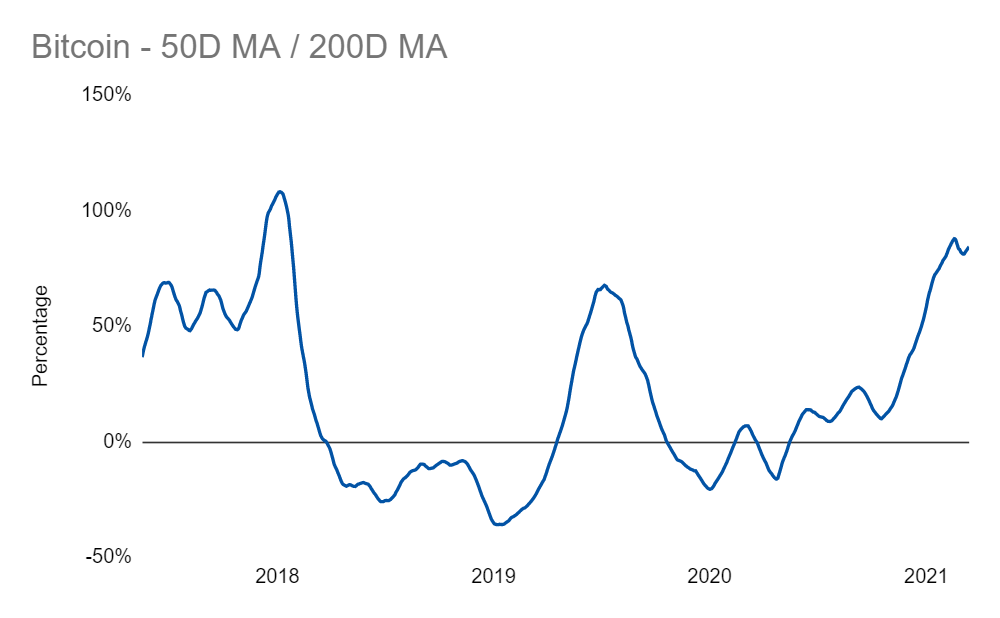
Current moving average levels are well off any death cross:
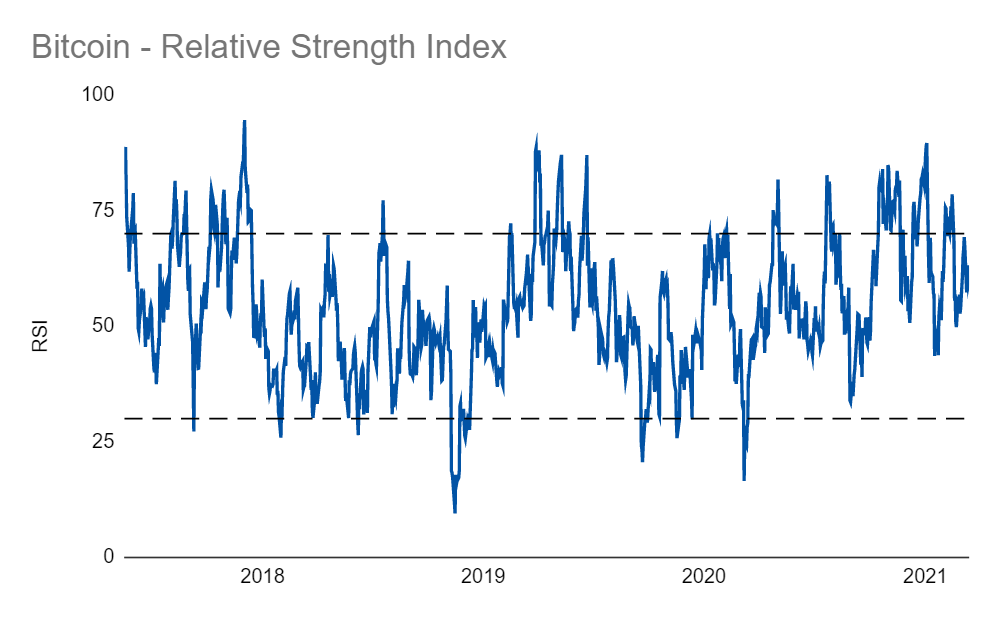
And RSI levels are elevated but remain below the overbought threshold:
The big surprise in these metrics is how they make the price cycle more clear. I’ve been involved with crypto trading for about five years now and kind of wish I had paid more attention to these more stable trends than the volatility that occurs day to day. I’m still planning to add Bitcoin to the Endless Metrics fund eventually but, as these charts show, a reasonable entry point may be some time from now.
Links
Yesterday’s Post | Most Popular Posts | All Historical Posts | Contact
Tracking Portfolios
Overall Comparison | Wild Stuff - Chart | Shiny Stuff - Chart | Safe Stuff - Chart | Big Stuff - Chart | Random Stuff - Chart
Live Charts
Ten-Year Treasury Less Two-Year Treasury | Ten-Year Breakeven Inflation Rate | S&P 500 | S&P Rolling All-Time High | S&P 500 Drawdown | S&P 500 Rogue Wave Indicator | S&P 500 Moving Averages | S&P 500 / 200-Day Moving Average | S&P 500 / 50-Day Moving Average | S&P 500 50-Day Moving Average / 200-Day Moving Average | S&P 500 Relative Strength Index | CBOE Volatility Index (VIX) | Three-Month USD LIBOR | Three-Month Treasury Bill (Secondary Rate) | TED Spread | Price of Bitcoin | Bitcoin Rolling All-Time High | Bitcoin Drawdown | Bitcoin Rogue Wave Indicator | Nasdaq Composite Index | Nasdaq Composite All-Time High | Nasdaq Composite Drawdown | Nasdaq Composite Wave Indicator | Nasdaq Composite Moving Averages | Nasdaq Composite / 200-Day Moving Average | Nasdaq Composite / 50-Day Moving Average | Nasdaq Composite 50-Day Moving Average / 200-Day Moving Average | Nasdaq Composite Relative Strength Index


