

Gold Price Metrics: Moving Averages, Rolling All-time High, Drawdown, Rogue Waves, and RSI
Gold Price Metrics: Moving Averages, Rolling All-time High, Drawdown, Rogue Waves, and RSI
Cool charts about a shiny metal
I love all of the visualizations one can do with just price. Since we’ve recently looked at these price-transformation metrics for stocks, bonds, and Bitcoin, it only makes sense to check out gold as well:

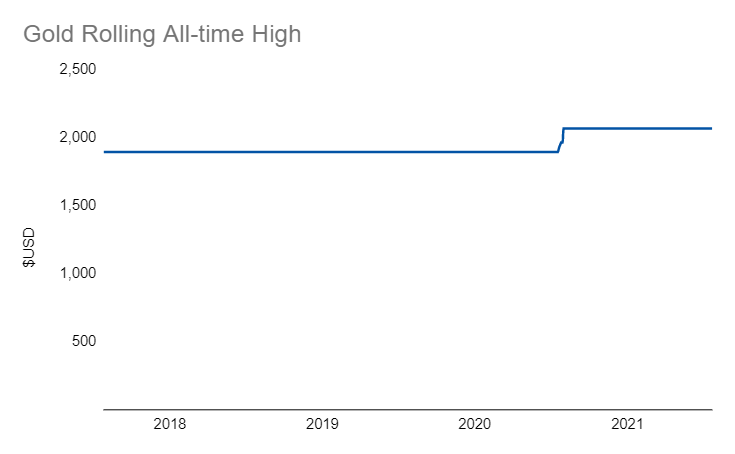
Gold is similar to Bitcoin in that it doesn’t set new all-time highs very often (though unlike Bitcoin it also doesn’t go absolutely mental exploding in price when it does hit a new record):
What’s crazy for Gold is that, just over a year before it set a new all-time high you would have been down almost 40% if you had bought at he last all-time high which was set in all the way back in 2011:
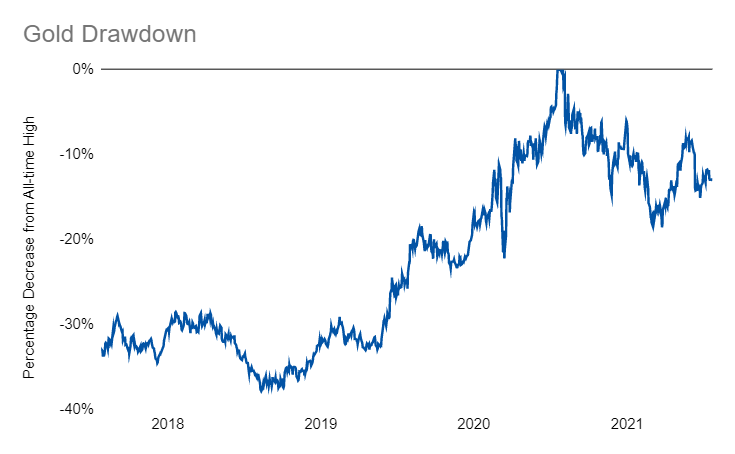
And, just because it’s a physical, tangible, and “safe” investment doesn’t mean it is immune to volatility:

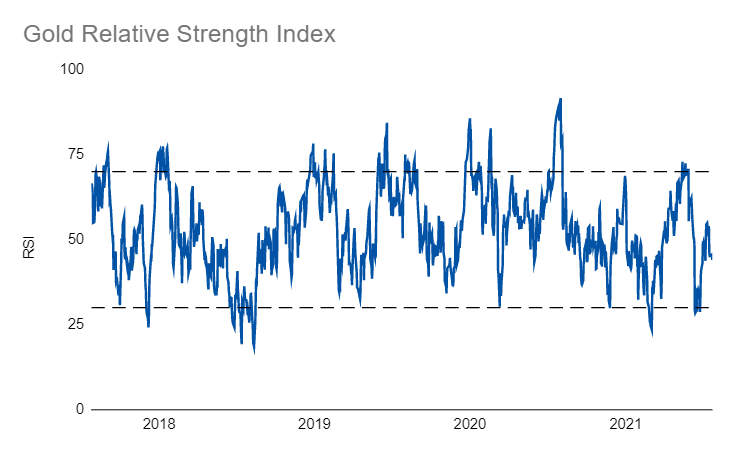
Right now, the RSI on gold is just about neutral:
So, should you buy some gold? I have a little bit for diversification (plus who doesn’t like shiny stuff) but it certainly isn’t the most exciting investment out there these days, that’s for sure!