
Beta, Return on Equity, and Return on Assets
I don’t care if they are officially “Alphabet.” I’m still calling them Google:
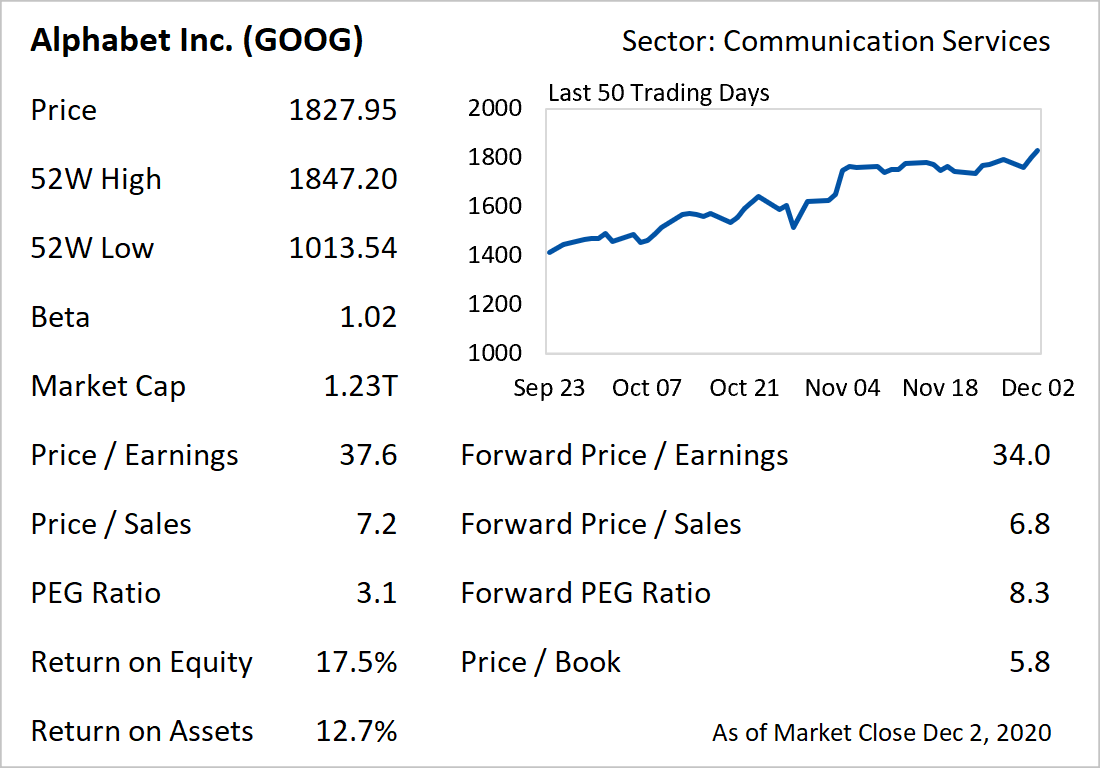
New additions to today’s daily stock analysis template include Beta, Return on Equity, and Return on Assets.
Beta
For Beta, I first removed the 52-week range because it was essentially useless (just substract the 52-week high by the 52-week low if you miss it). Beta is a much more popular metric for stocks anyways.
The most intuitive way to think about Beta is that it measures the size of a stock’s movement relative to the broader market. For example, if a stock has a Beta of 2, you could say that, generally, if the market goes up 1%, a stock with a Beta of 2 will go up 2%. Whether you want stocks with high Beta or low Beta depends. If the market is going higher (lower), maybe you want higher (lower) Beta to get bigger (smaller) movement relative to the market.
Return on Equity
This is a classic profitability/efficiency metric. You take net income and divide it by equity. The idea is, how much return are investors getting for the money they have put into a company? Obviously, you want this to be higher.
Return on Assets
A similar metric to return on equity but still important. Every company has an asset base. How well can a company use those assets to create profit? This is very different across industries. For example, you might (very simply) say that Google has servers and works with data versus an industrial company that needs a lot of machinery to make a product. So, this metric, like all the others, requires some proper peer analysis. Higher is better.