
Highlighting AAPL
Single-company focused metrics
One way we can use all the the metrics we are building out is by highlighting how easy it is to look at a single company for analysis. Take, for example, Apple:
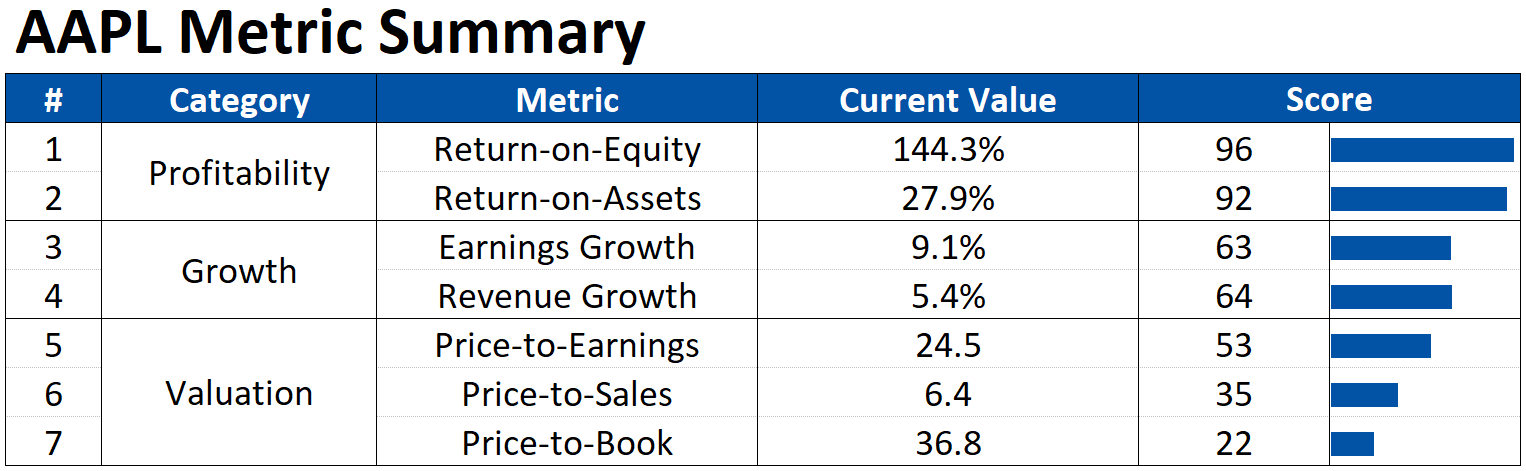
In this table at a glance we can see the current value of each metric and how each one stacks up against the market from 0 to 100 (where higher is better). It’s pretty quickly obvious that Apple has strong profitability and solid growth but that it comes at the cost of an elevated valuation.
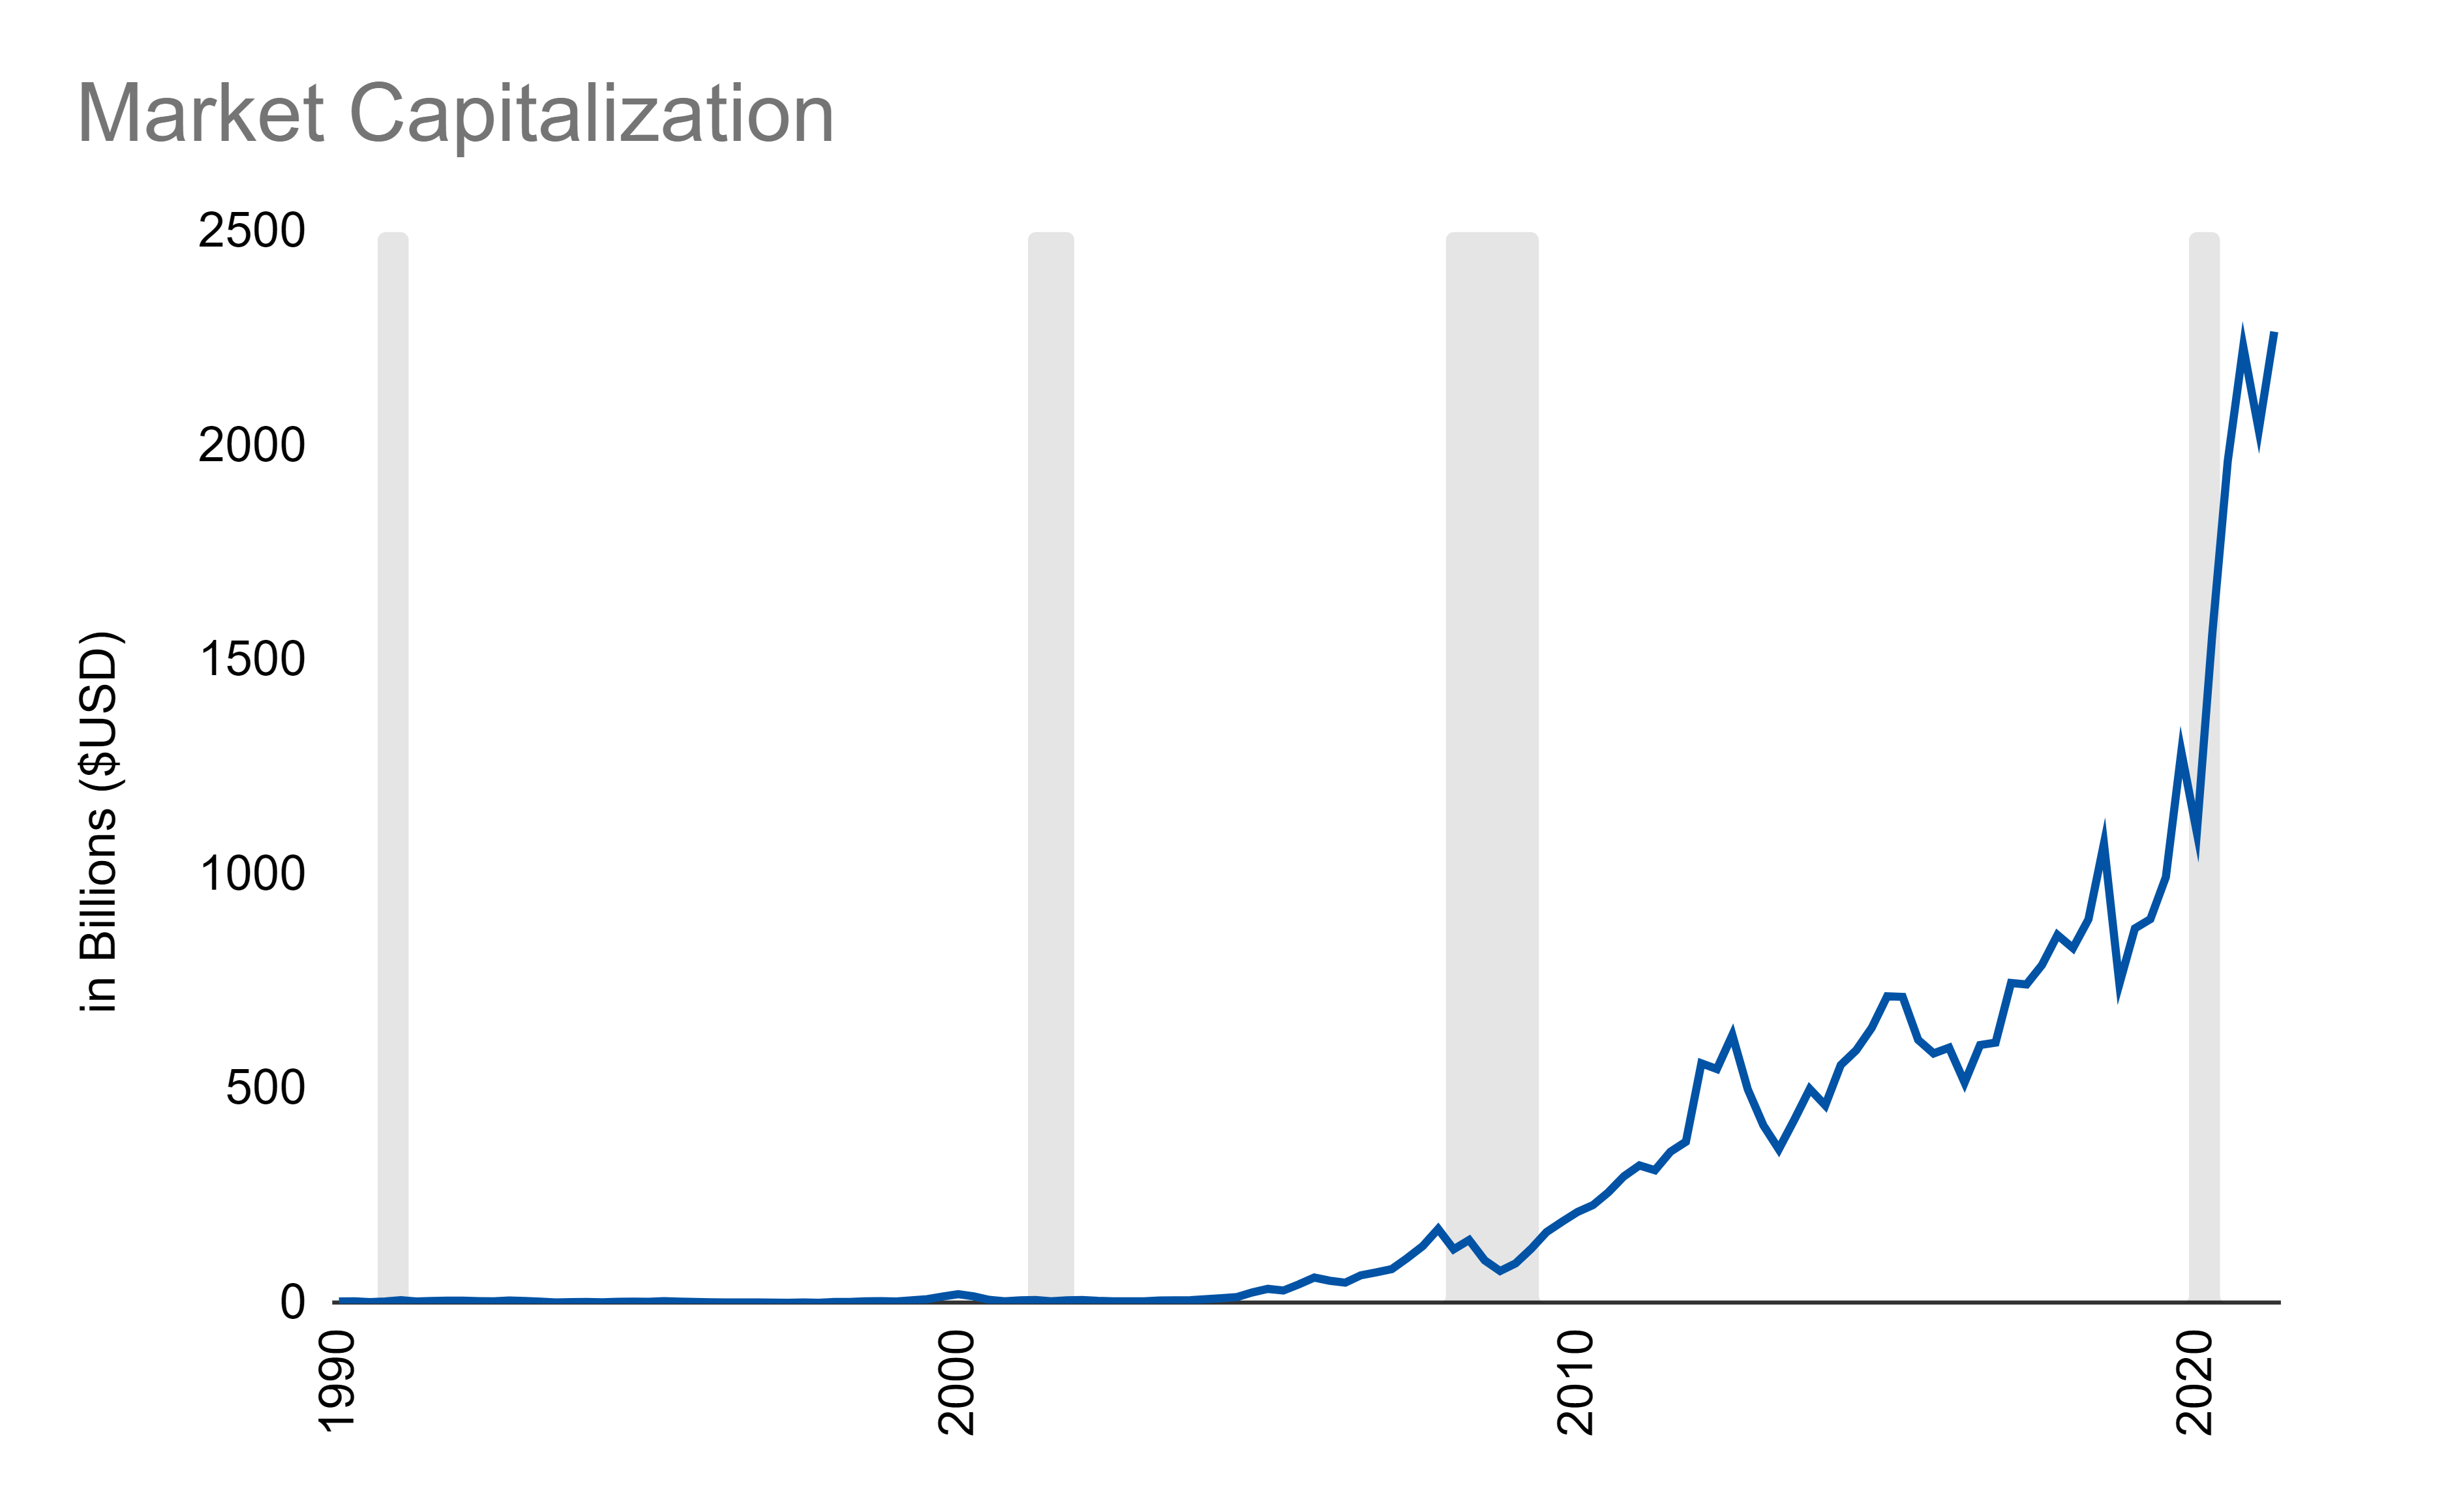
We can also look at some key metrics through time such as market capitalization:
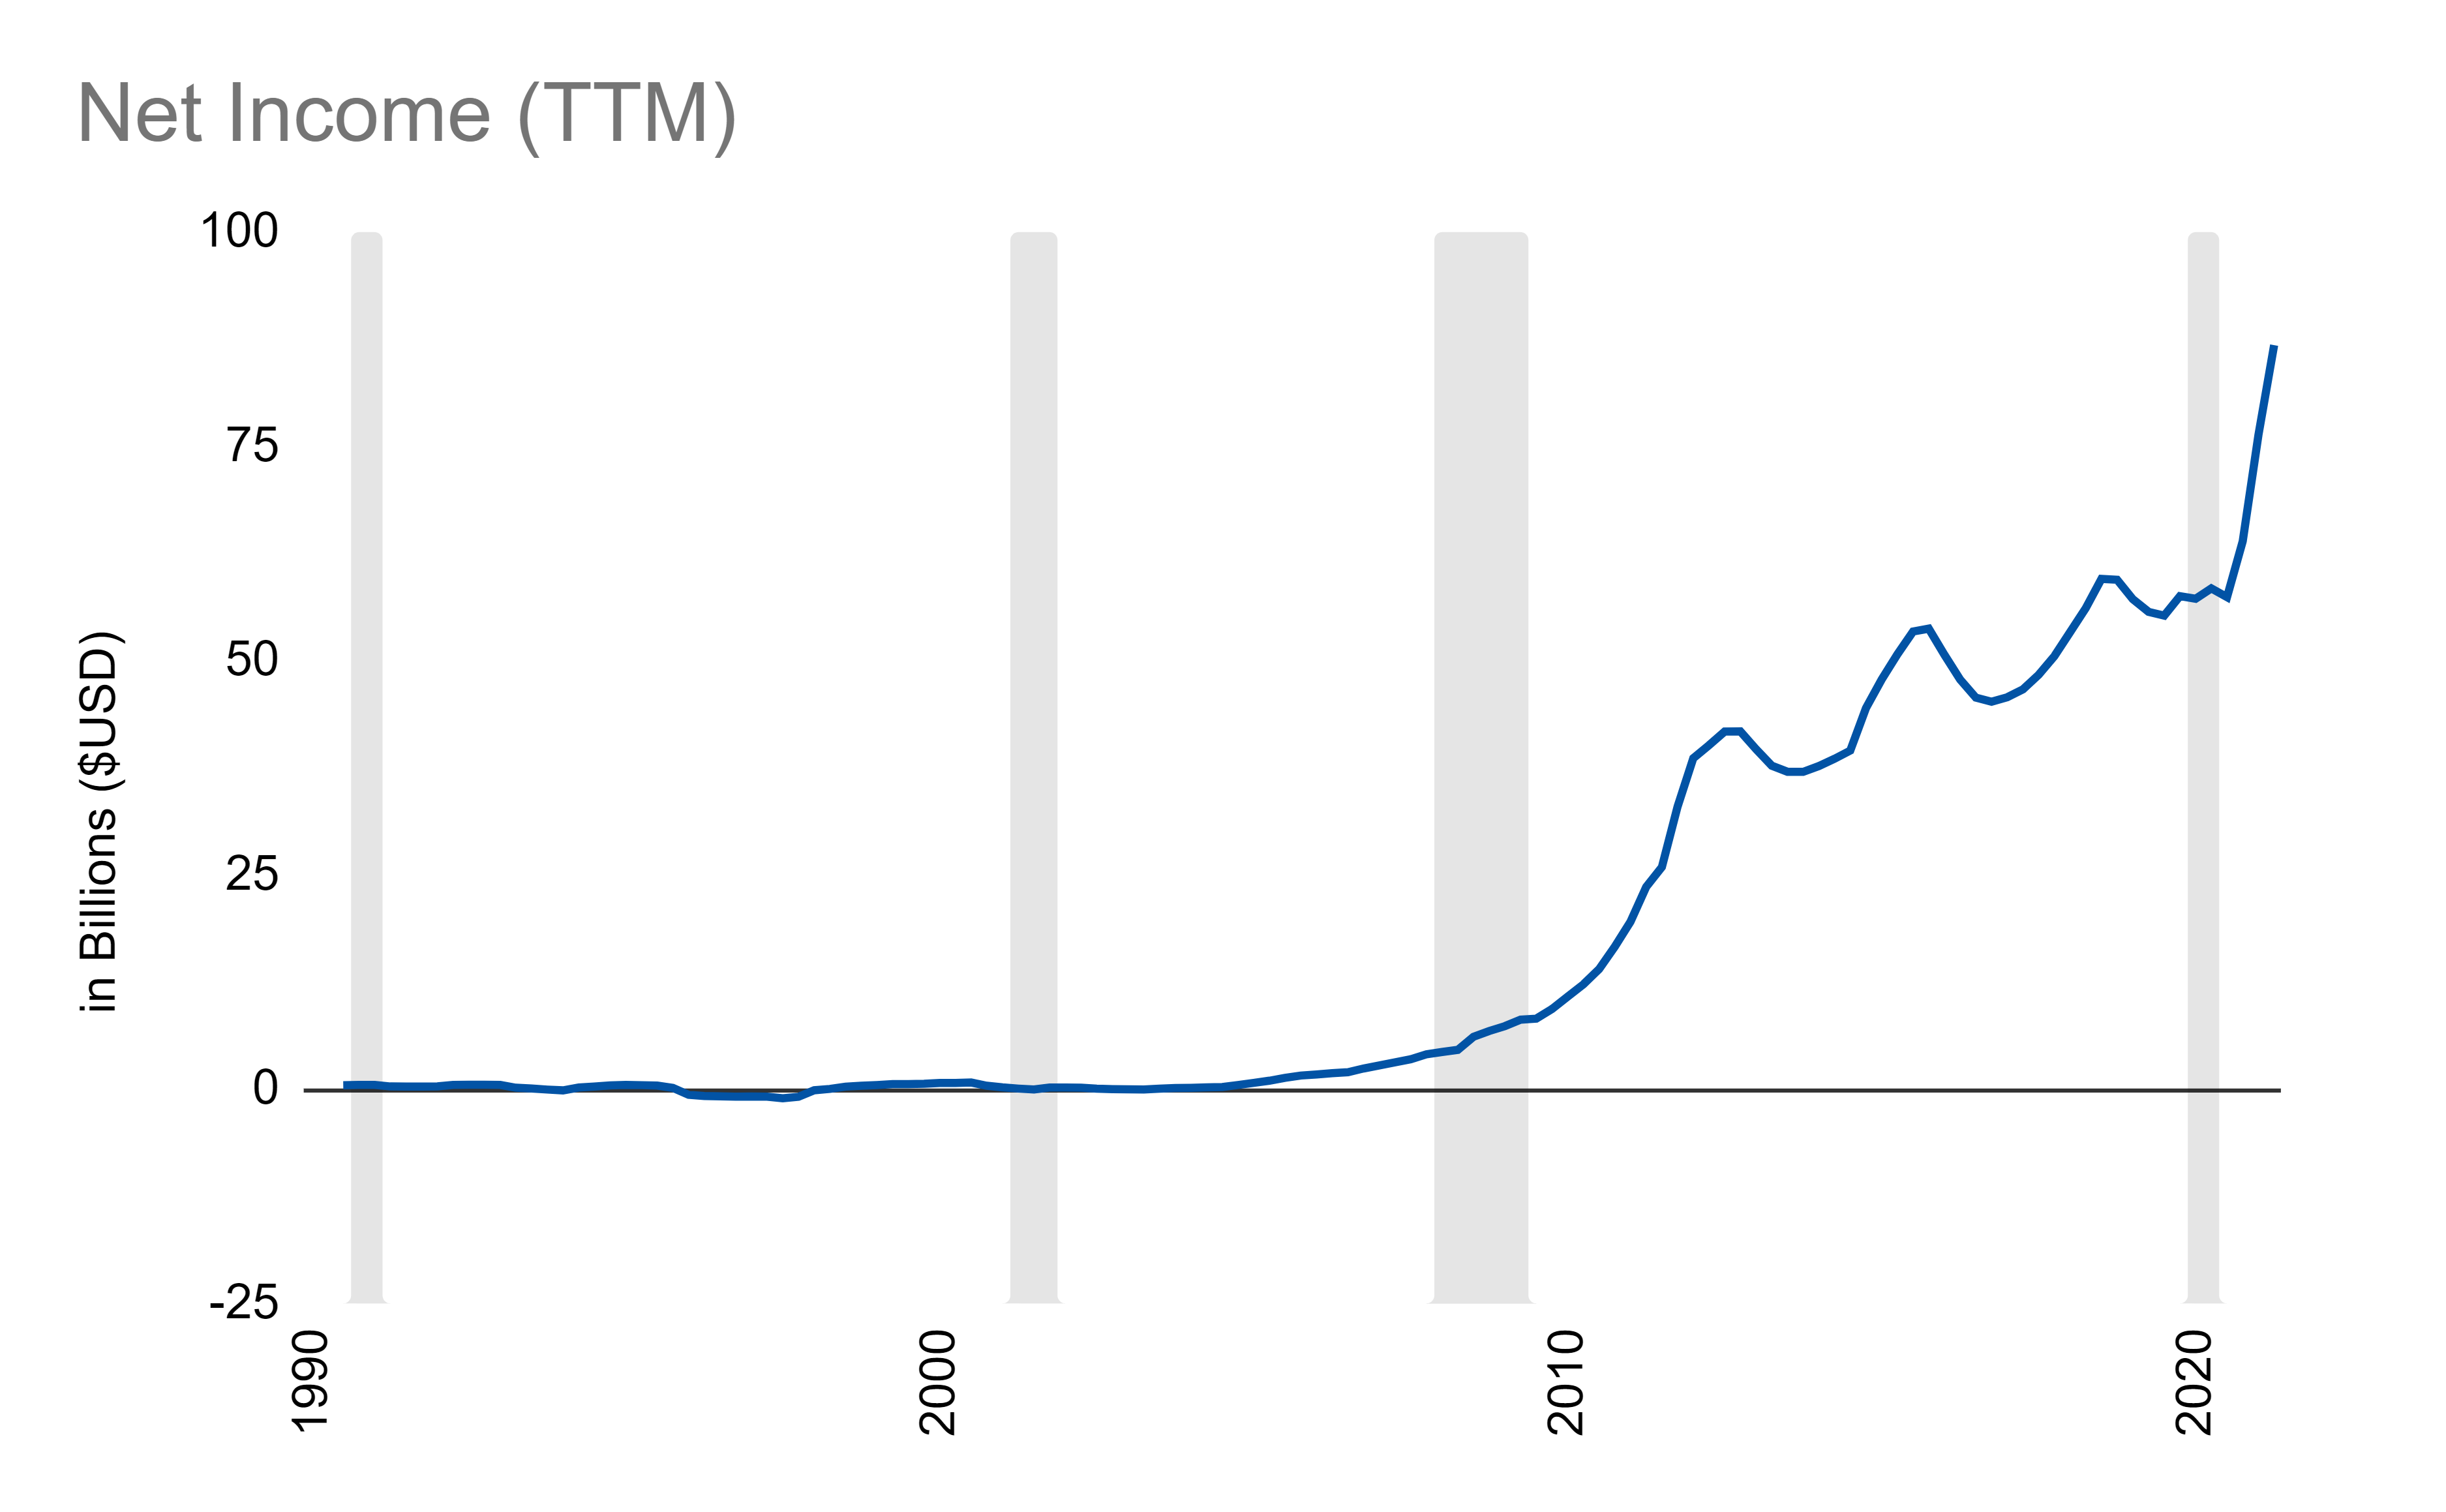
Net income:
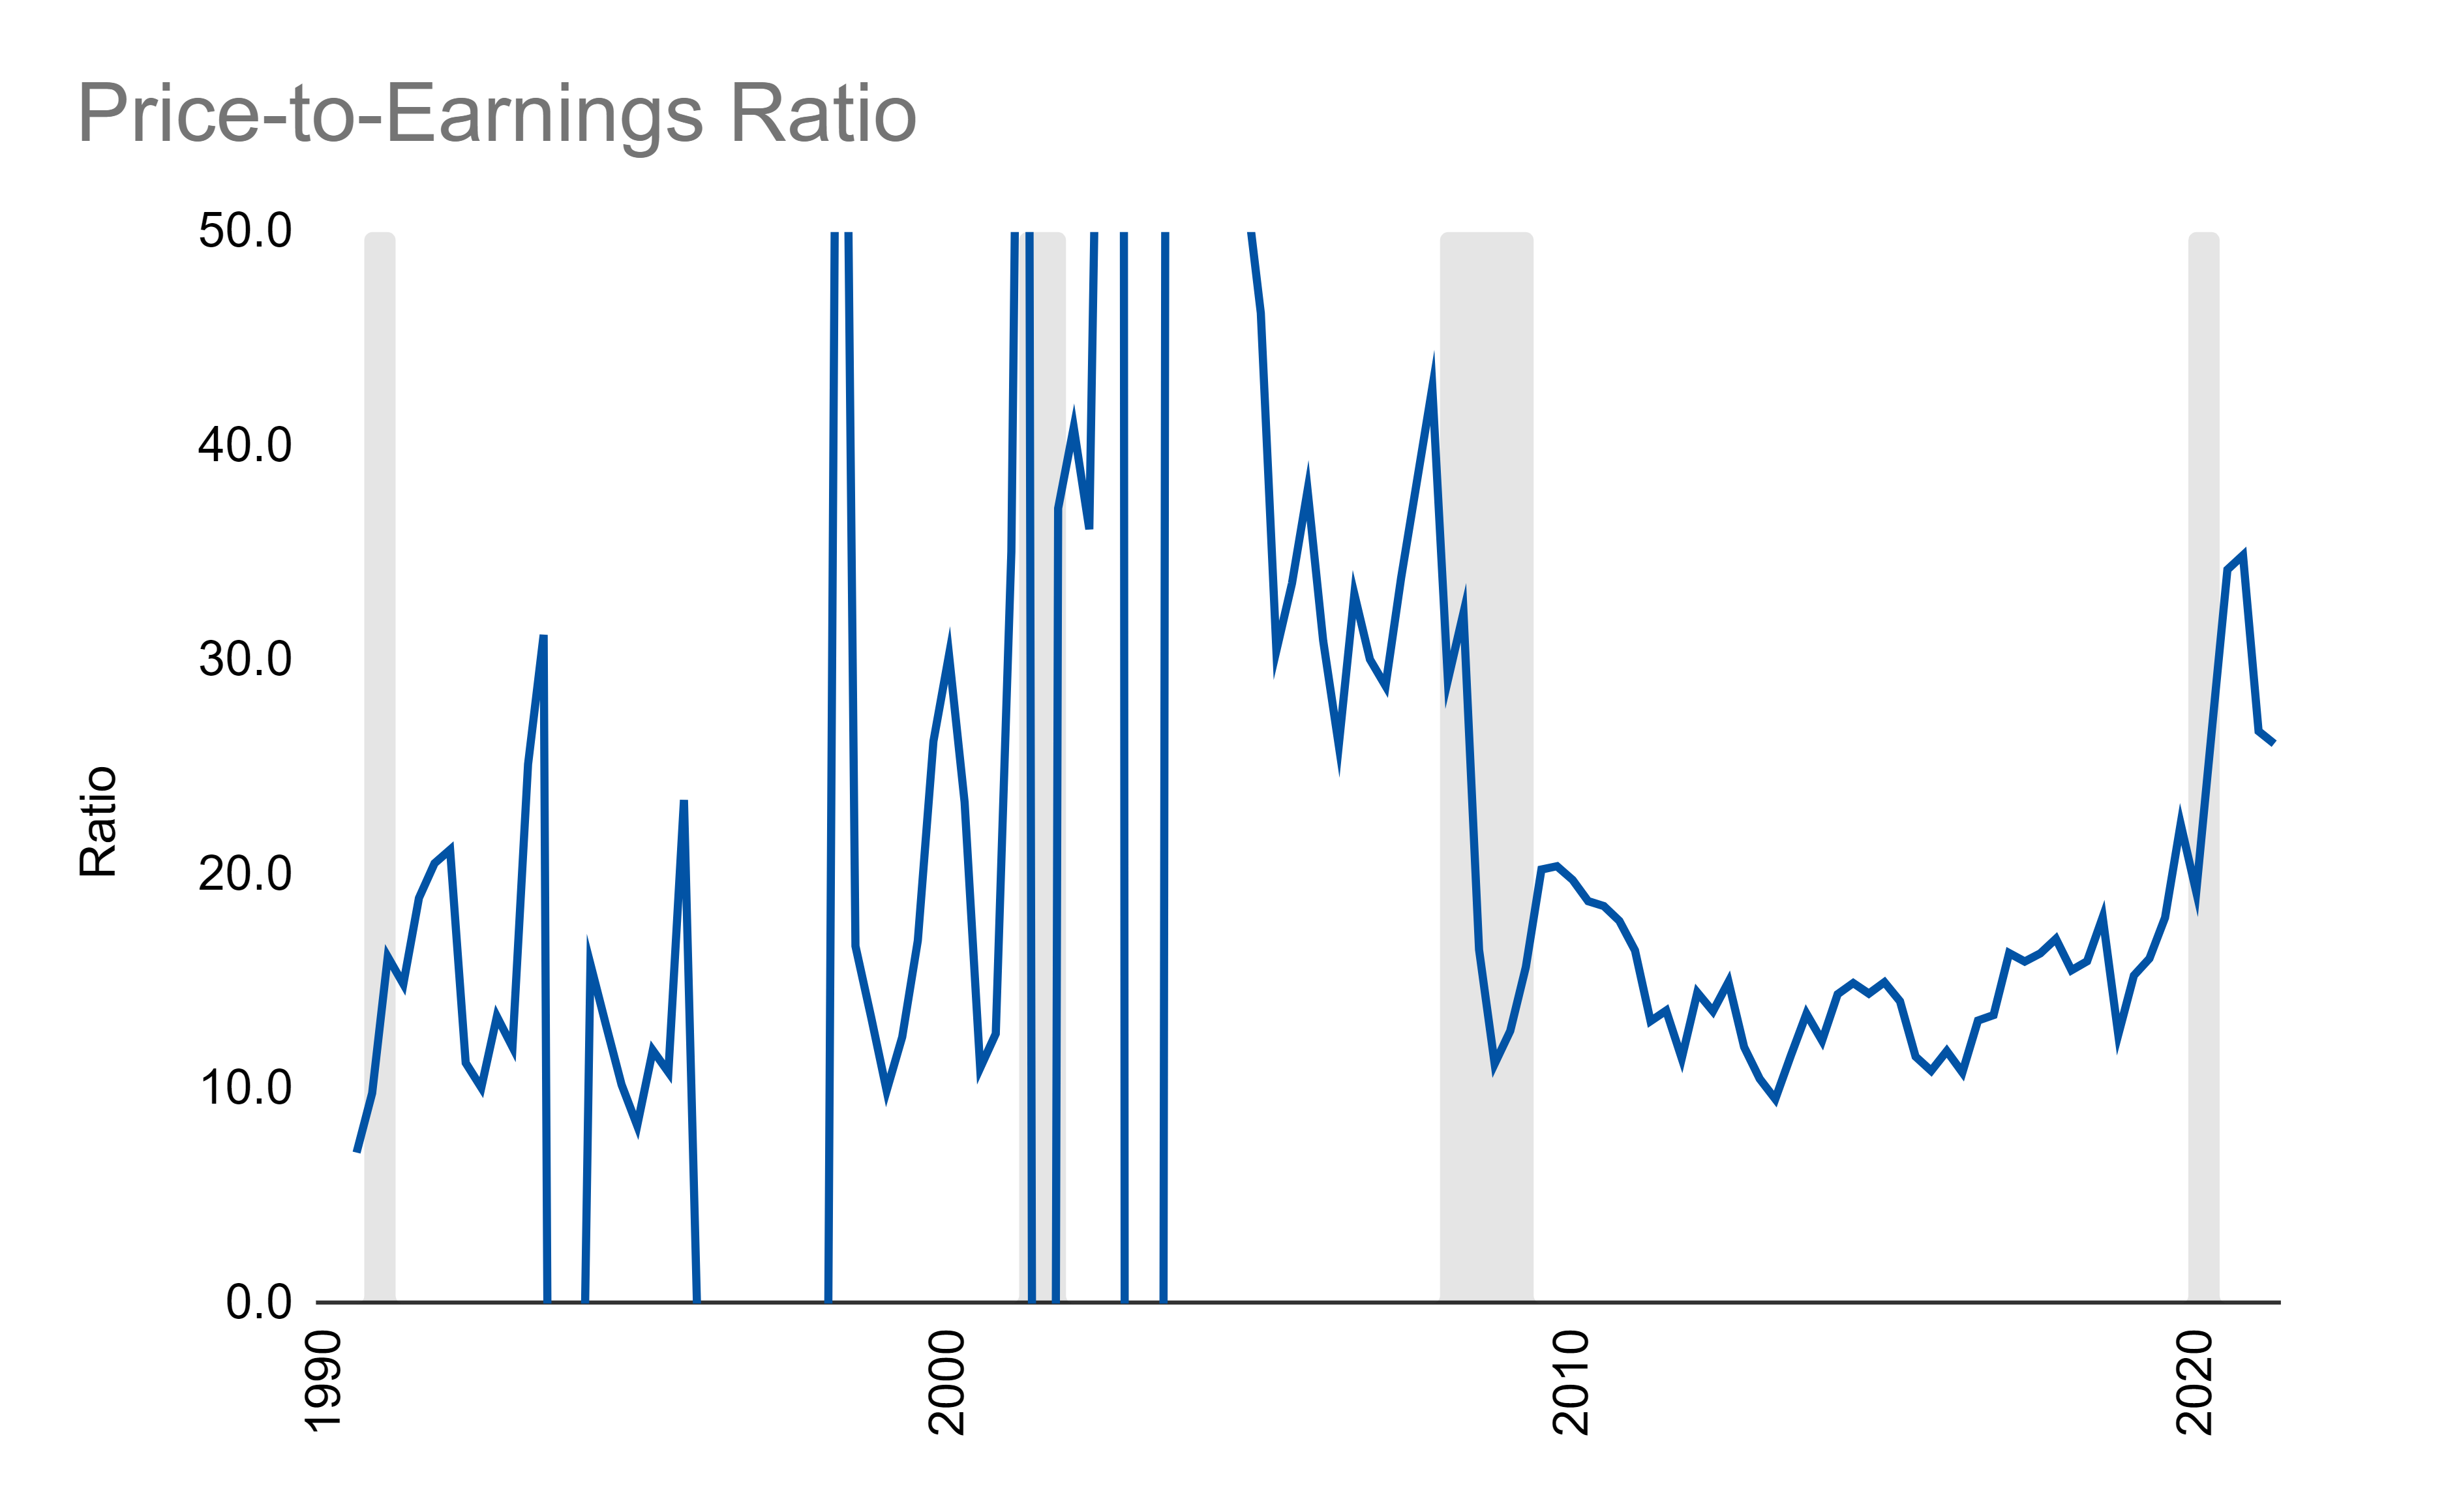
And the resulting price-to-earnings ratio, which was a bit crazy prior to the last ten years:
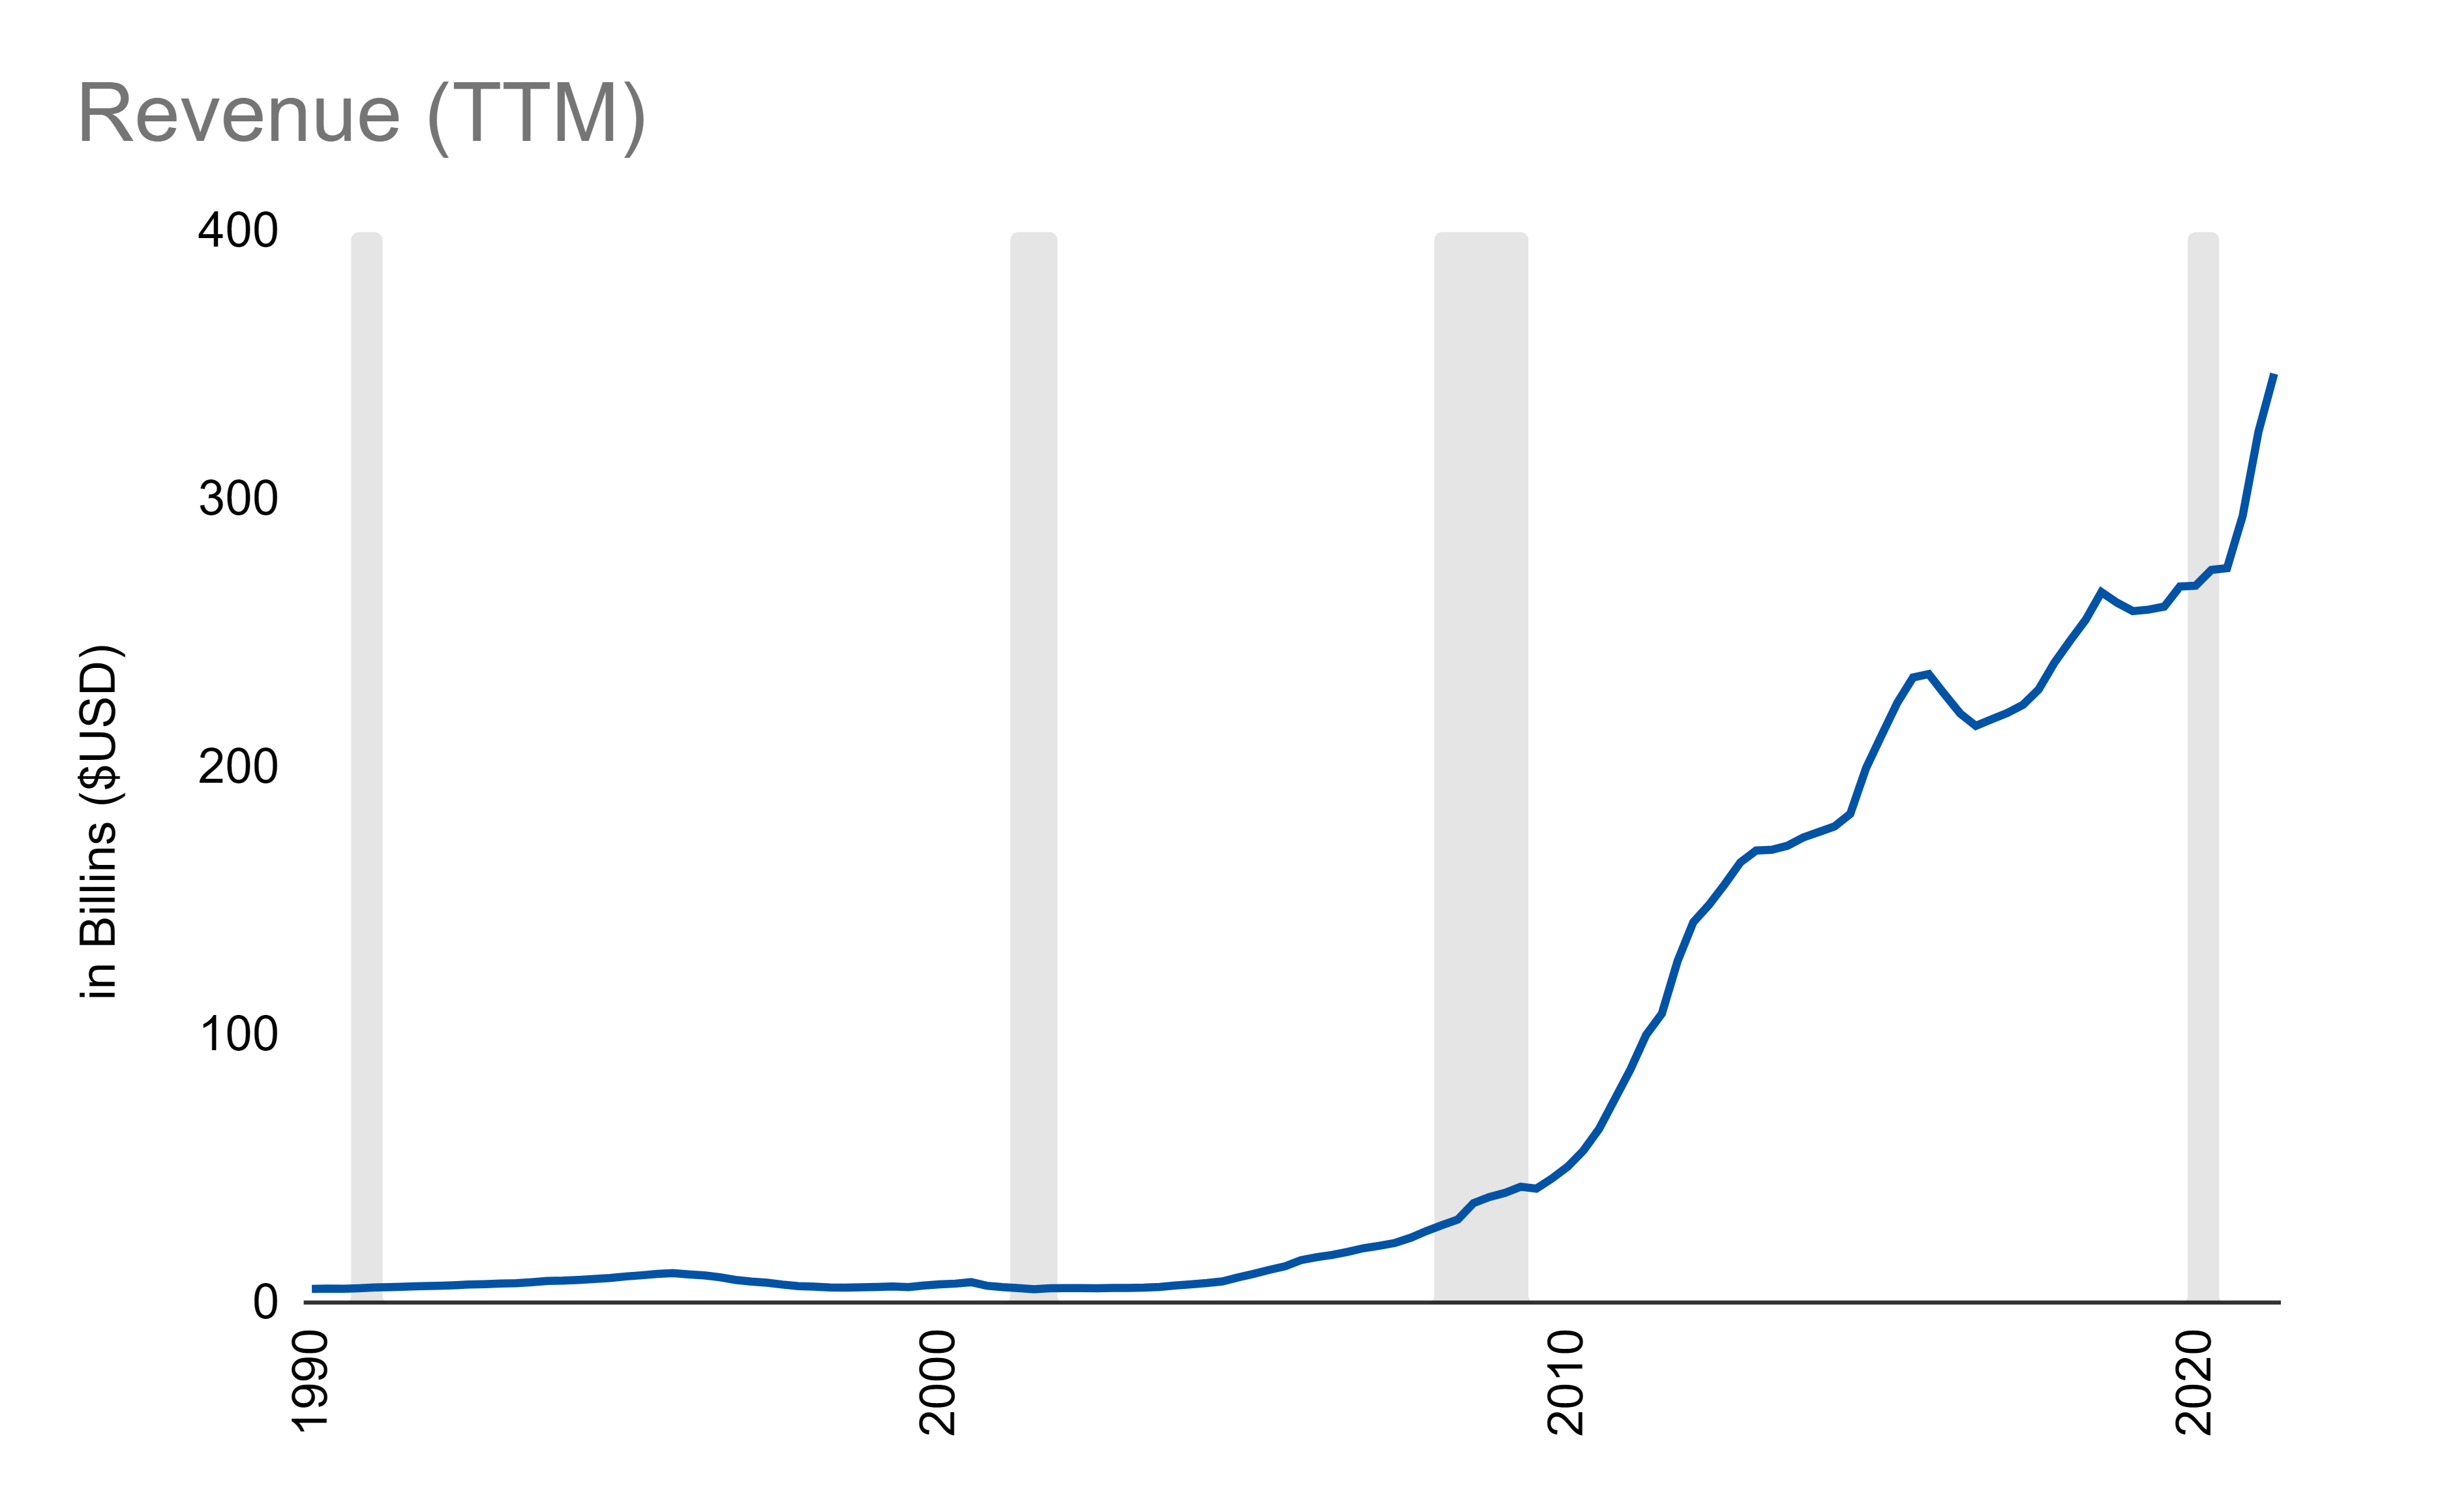
We can also look at revenue:
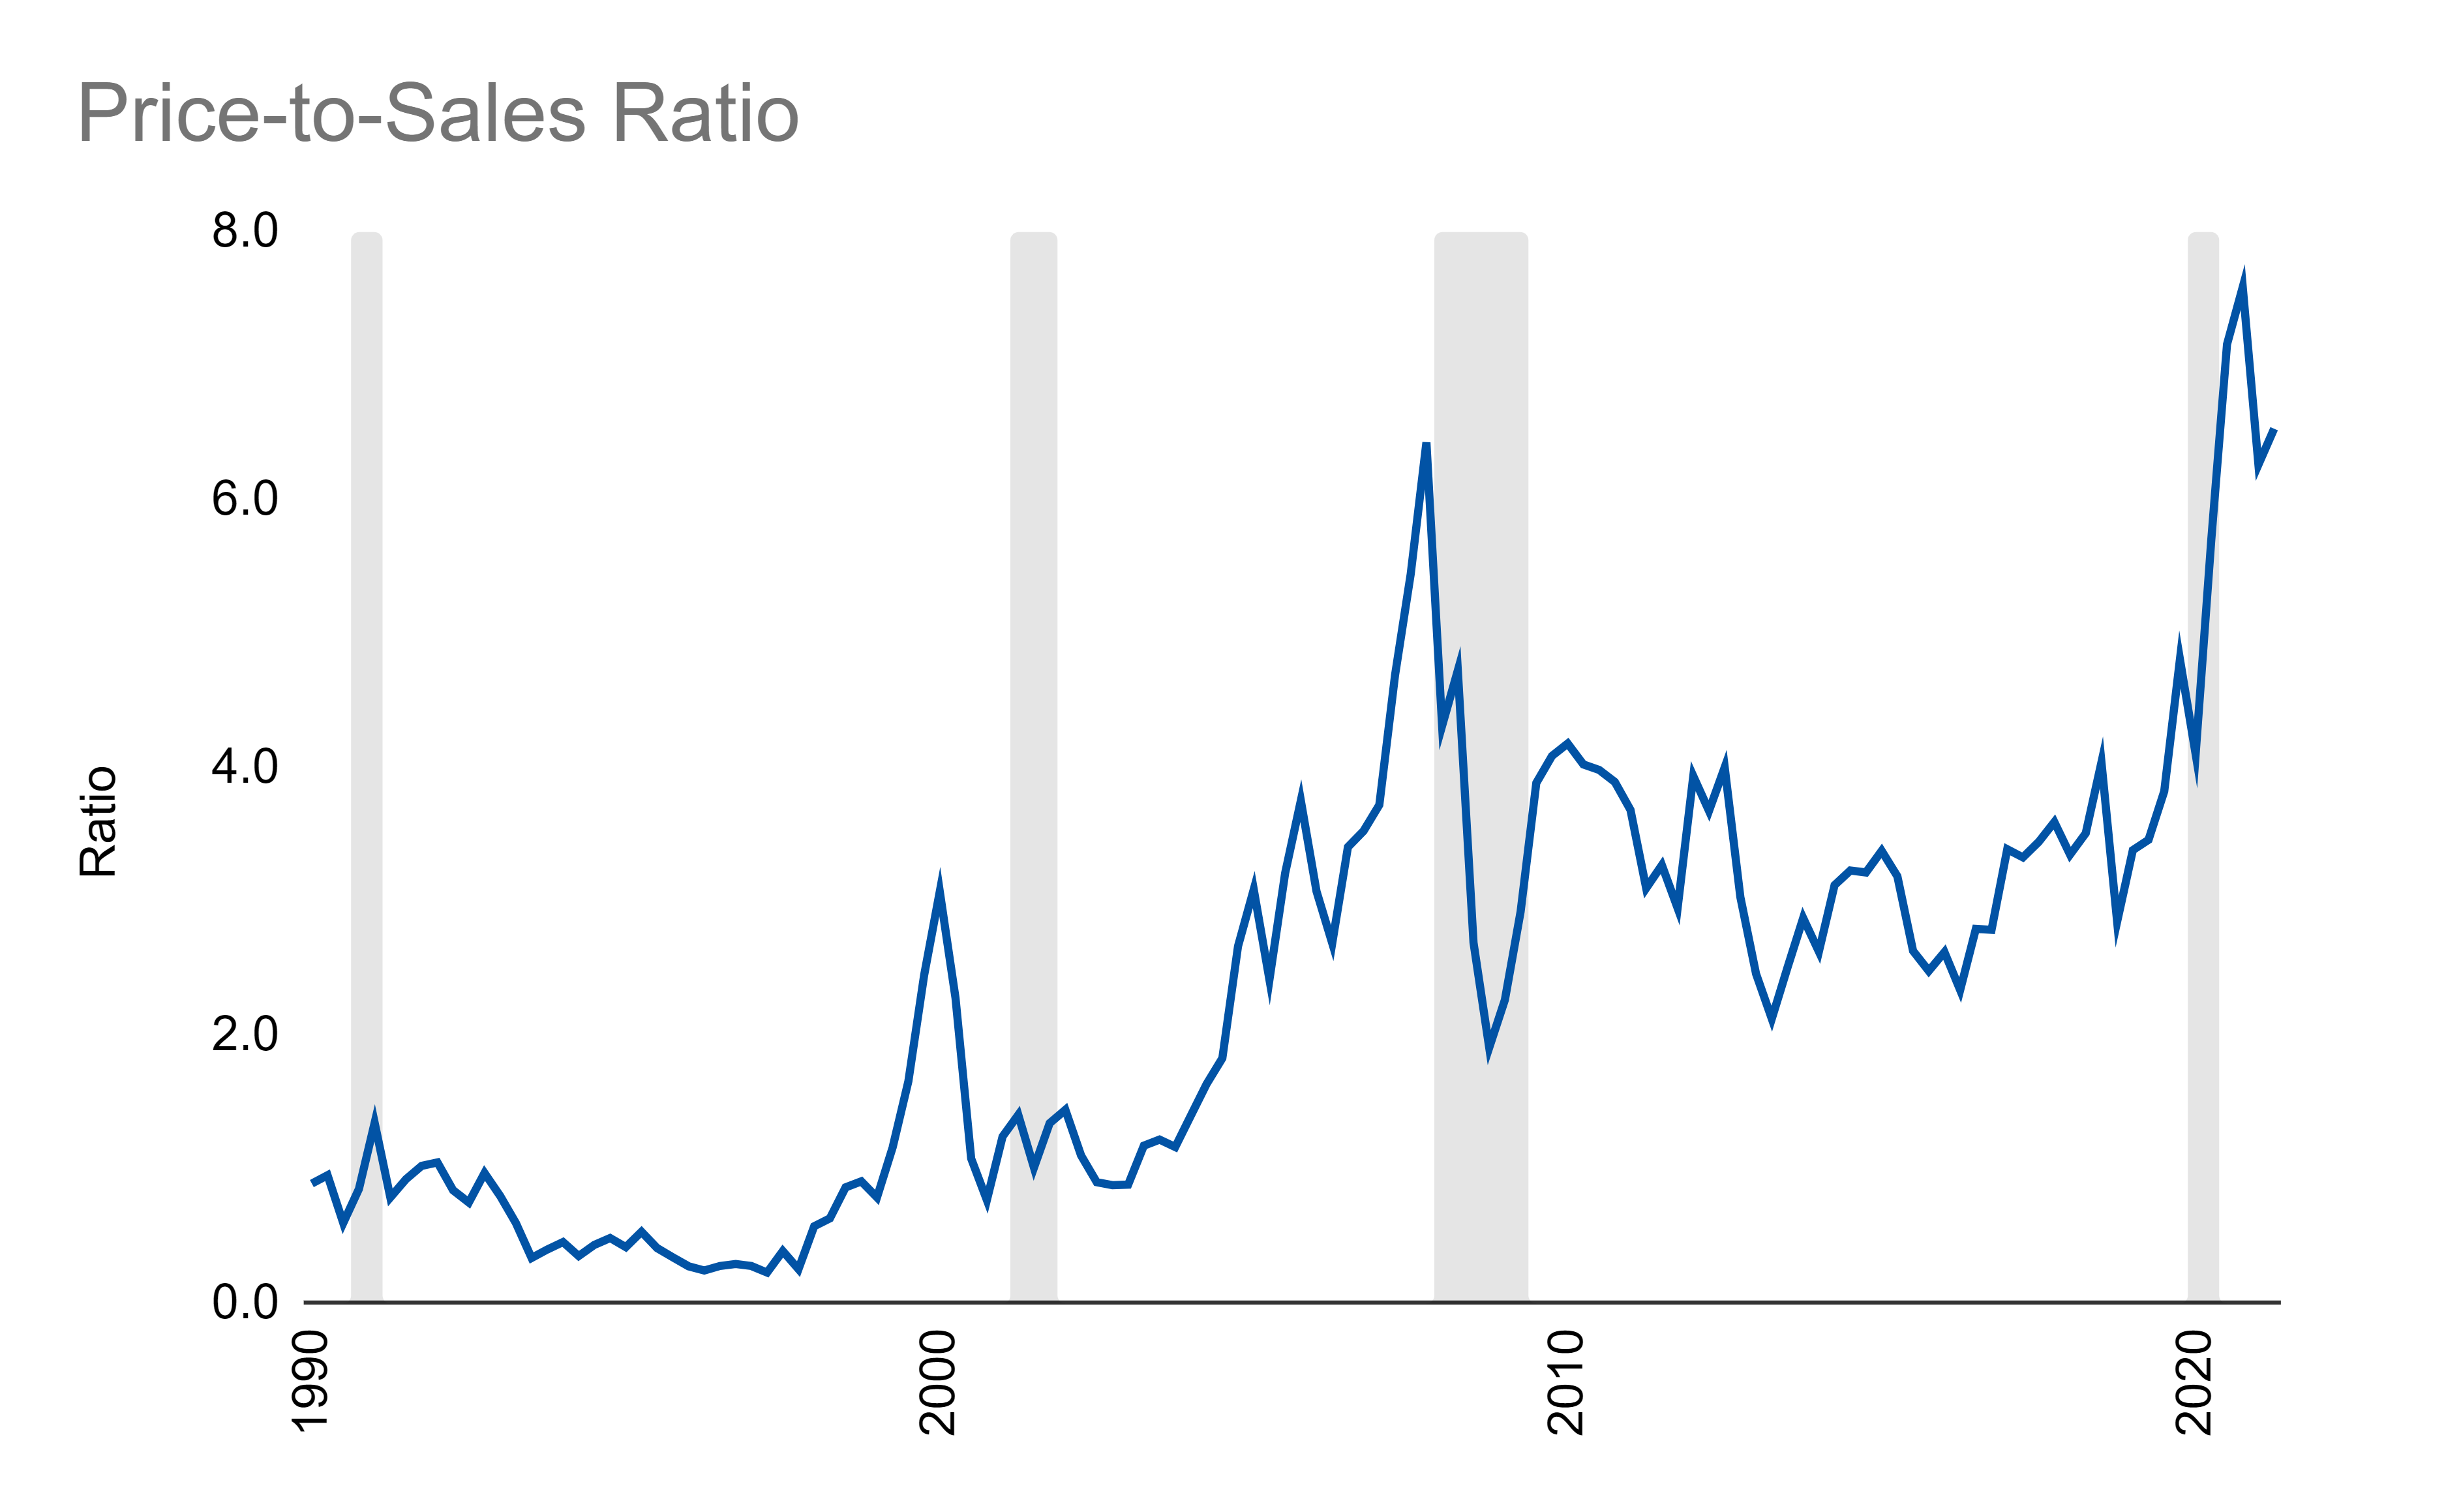
And price-to-sales, which shows us something similar to price-to-earnings but without the craziness:
All that being said, this type of analysis is extremely quick to put together now. I just need to type in a ticker. So, expect more of this with deeper thoughts about whether a given stock is a competitive candidate or not.
Furthermore, we will be building out even more metrics to look at! That means, our single-company deep dives are gonna go even deeper into solid fundamental analysis to help you better understand a company’s position.
Links
Most Popular Posts | All Historical Posts | Main Site | EM100 | EM1000