


How does wealth composition differ for the rich?
More equity, less pension
When we look at what kind of assets comprise household wealth, we actually see a fairly balanced picture:

However, if we consider what that composition looks like for various buckets of wealthy individuals, things look very different:
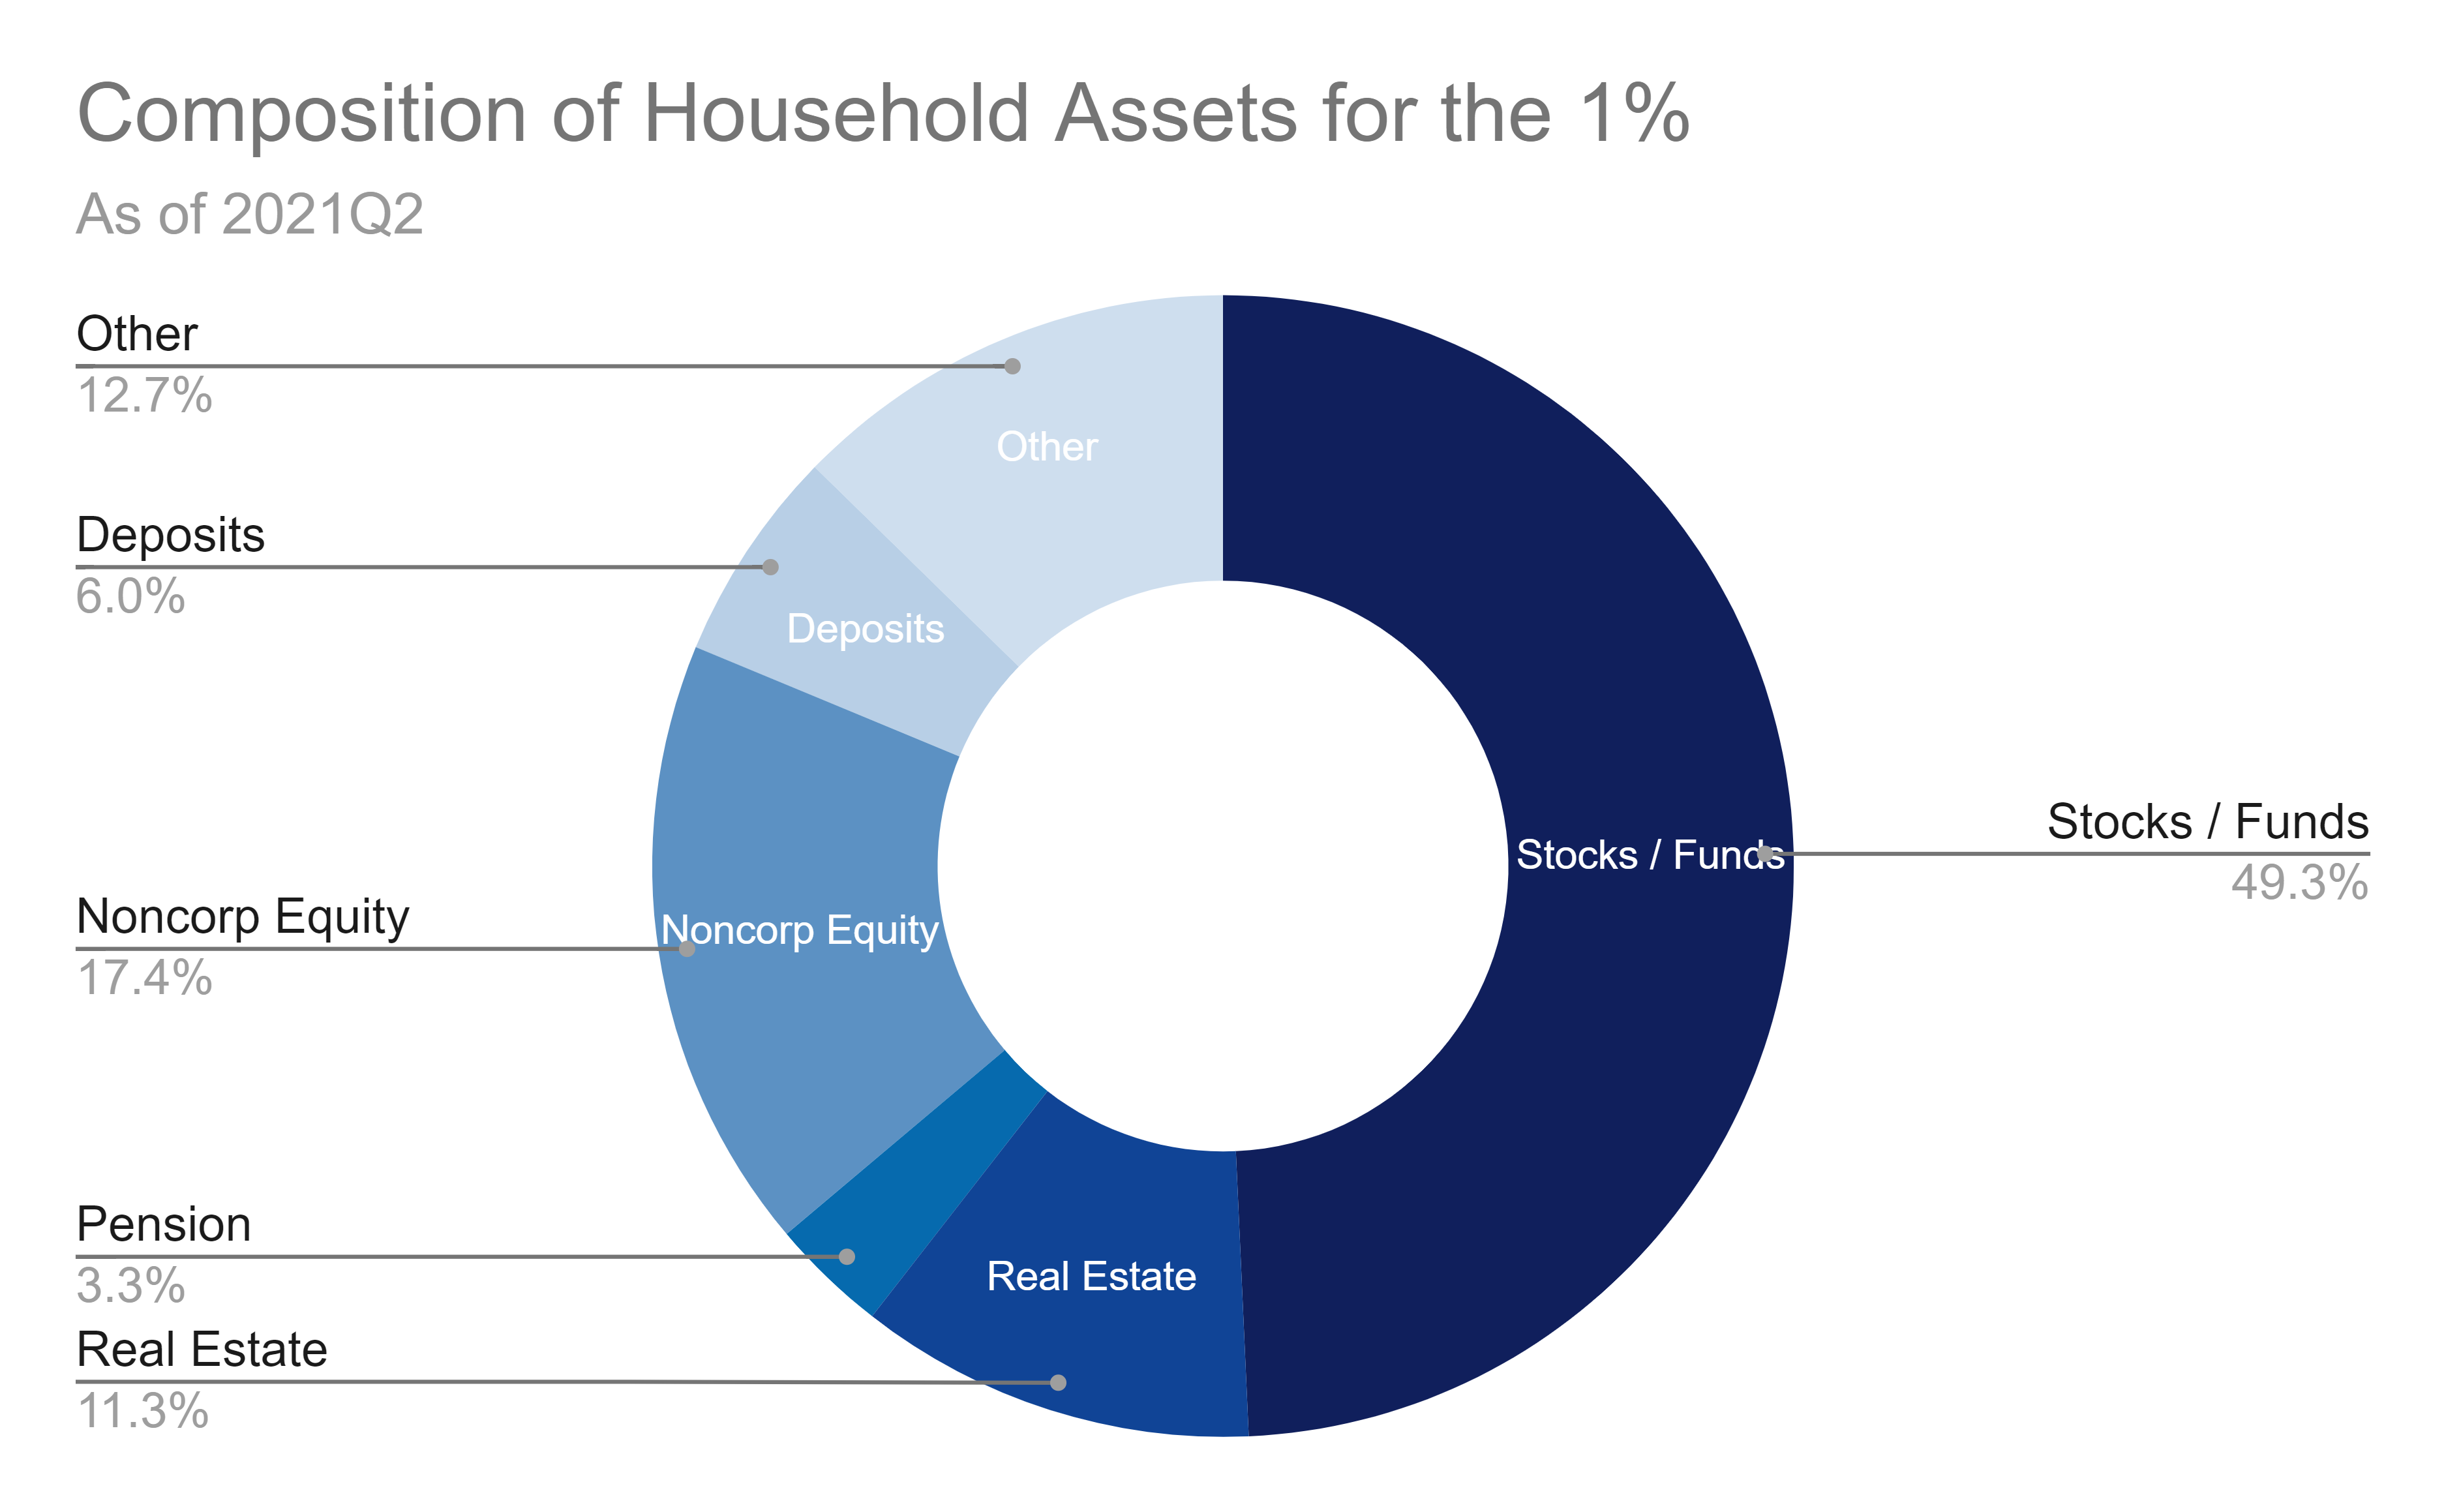
The top 1% have almost half of their wealth in stocks and mutual funds. They also have 17.4% in noncorporate equity on top of that!
The top 10% have half their proportion of wealth in stocks and a much larger chunk in pension entitlements:

Moving to the next wealth bucket, we see more in pension entitlements and real estate and even less in stocks:

Finally, we have the bottom 50%, who have almost half of their assets in real estate and almost nothing in stocks:

Thus, we see that wealth distribution isn’t just about some people having more money than others. There is a difference in the type of money (assets) that people own. And, for some types of assets there are extreme differences, with some groups of people having almost no exposure (relatively) to certain asset classes and others having a lot.
Links
Most Popular Posts | All Historical Posts | Main Site | EM100 | EM1000 | Contact