Using the same approach as yesterday, let’s look at the performance of large cap value stocks versus the broader market:
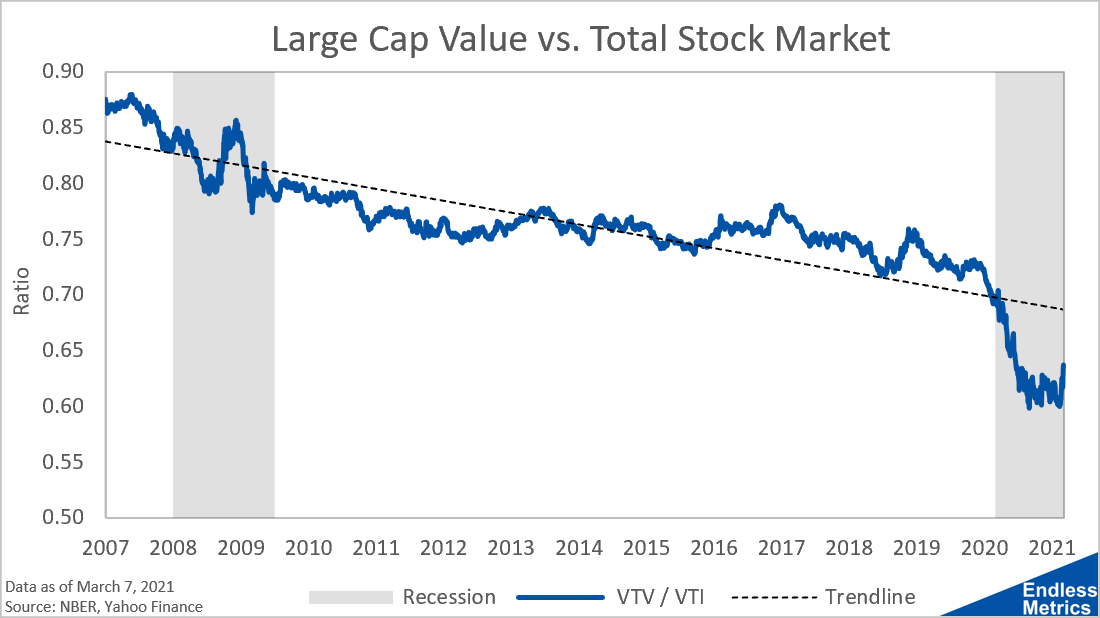
It’s clear that value has underperformed the market. But the recent underperformance becomes extremely apparent when those two time series are viewed as a ratio:
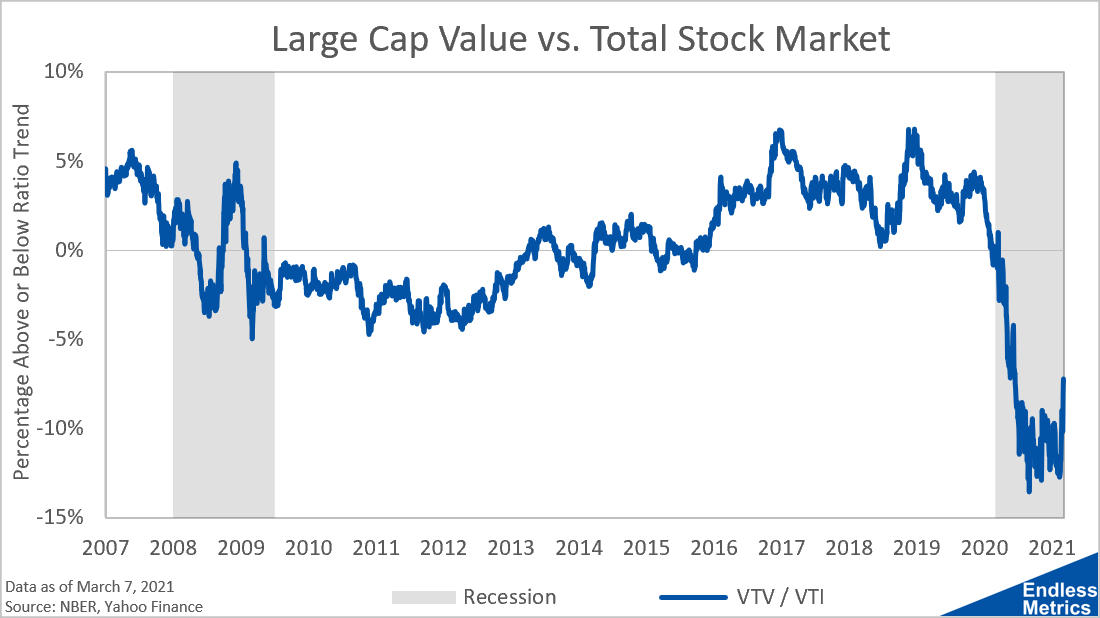
If we assume a long-term downtrend (versus a flat long-term average) and look at the distance from trend, we can see that large cap value stocks may offer some relatively advantageous valuation given their underperformance:
In the last few trading sessions, value has made a bit of a comeback. Even with that rotation, there’s still a long way to go - so don’t worry too much if you think you may be too late. There is still plenty of trend reversion to be had!
Links
Yesterday’s Post | Most Popular Posts | All Historical Posts | Contact
Portfolios
Main Portfolio | Wild Stuff | Shiny Stuff | Safe Stuff | Big Stuff | Random Stuff
Live Charts
Tracking Portfolio Performance | “Wild Stuff” Constituents | “Shiny Stuff” Constituents | “Safe Stuff” Constituents | Ten-Year Treasury Less Two-Year Treasury | Ten-Year Breakeven Inflation Rate | S&P 500 | S&P Rolling All-Time High | S&P 500 Drawdown | S&P 500 Rogue Wave Indicator | S&P 500 Moving Averages | S&P 500 / 200-Day Moving Average | S&P 500 / 50-Day Moving Average | S&P 500 50-Day Moving Average / 200-Day Moving Average | S&P 500 Relative Strength Index | CBOE Volatility Index (VIX) | Three-Month USD LIBOR | Three-Month Treasury Bill (Secondary Rate) | TED Spread | Price of Bitcoin | Bitcoin Rolling All-Time High | Bitcoin Drawdown | Bitcoin Rogue Wave Indicator | Nasdaq Composite Index | Nasdaq Composite All-Time High | Nasdaq Composite Drawdown | Nasdaq Composite Wave Indicator | Nasdaq Composite Moving Averages | Nasdaq Composite / 200-Day Moving Average | Nasdaq Composite / 50-Day Moving Average | Nasdaq Composite 50-Day Moving Average / 200-Day Moving Average | Nasdaq Composite Relative Strength Index


