
Leverage
Debt-to-Equity and Assets-to-Equity
Let’s consider two more metrics in our 2021 performance analysis. The first is a classic one for measuring leverage - the debt-to-equity ratio:
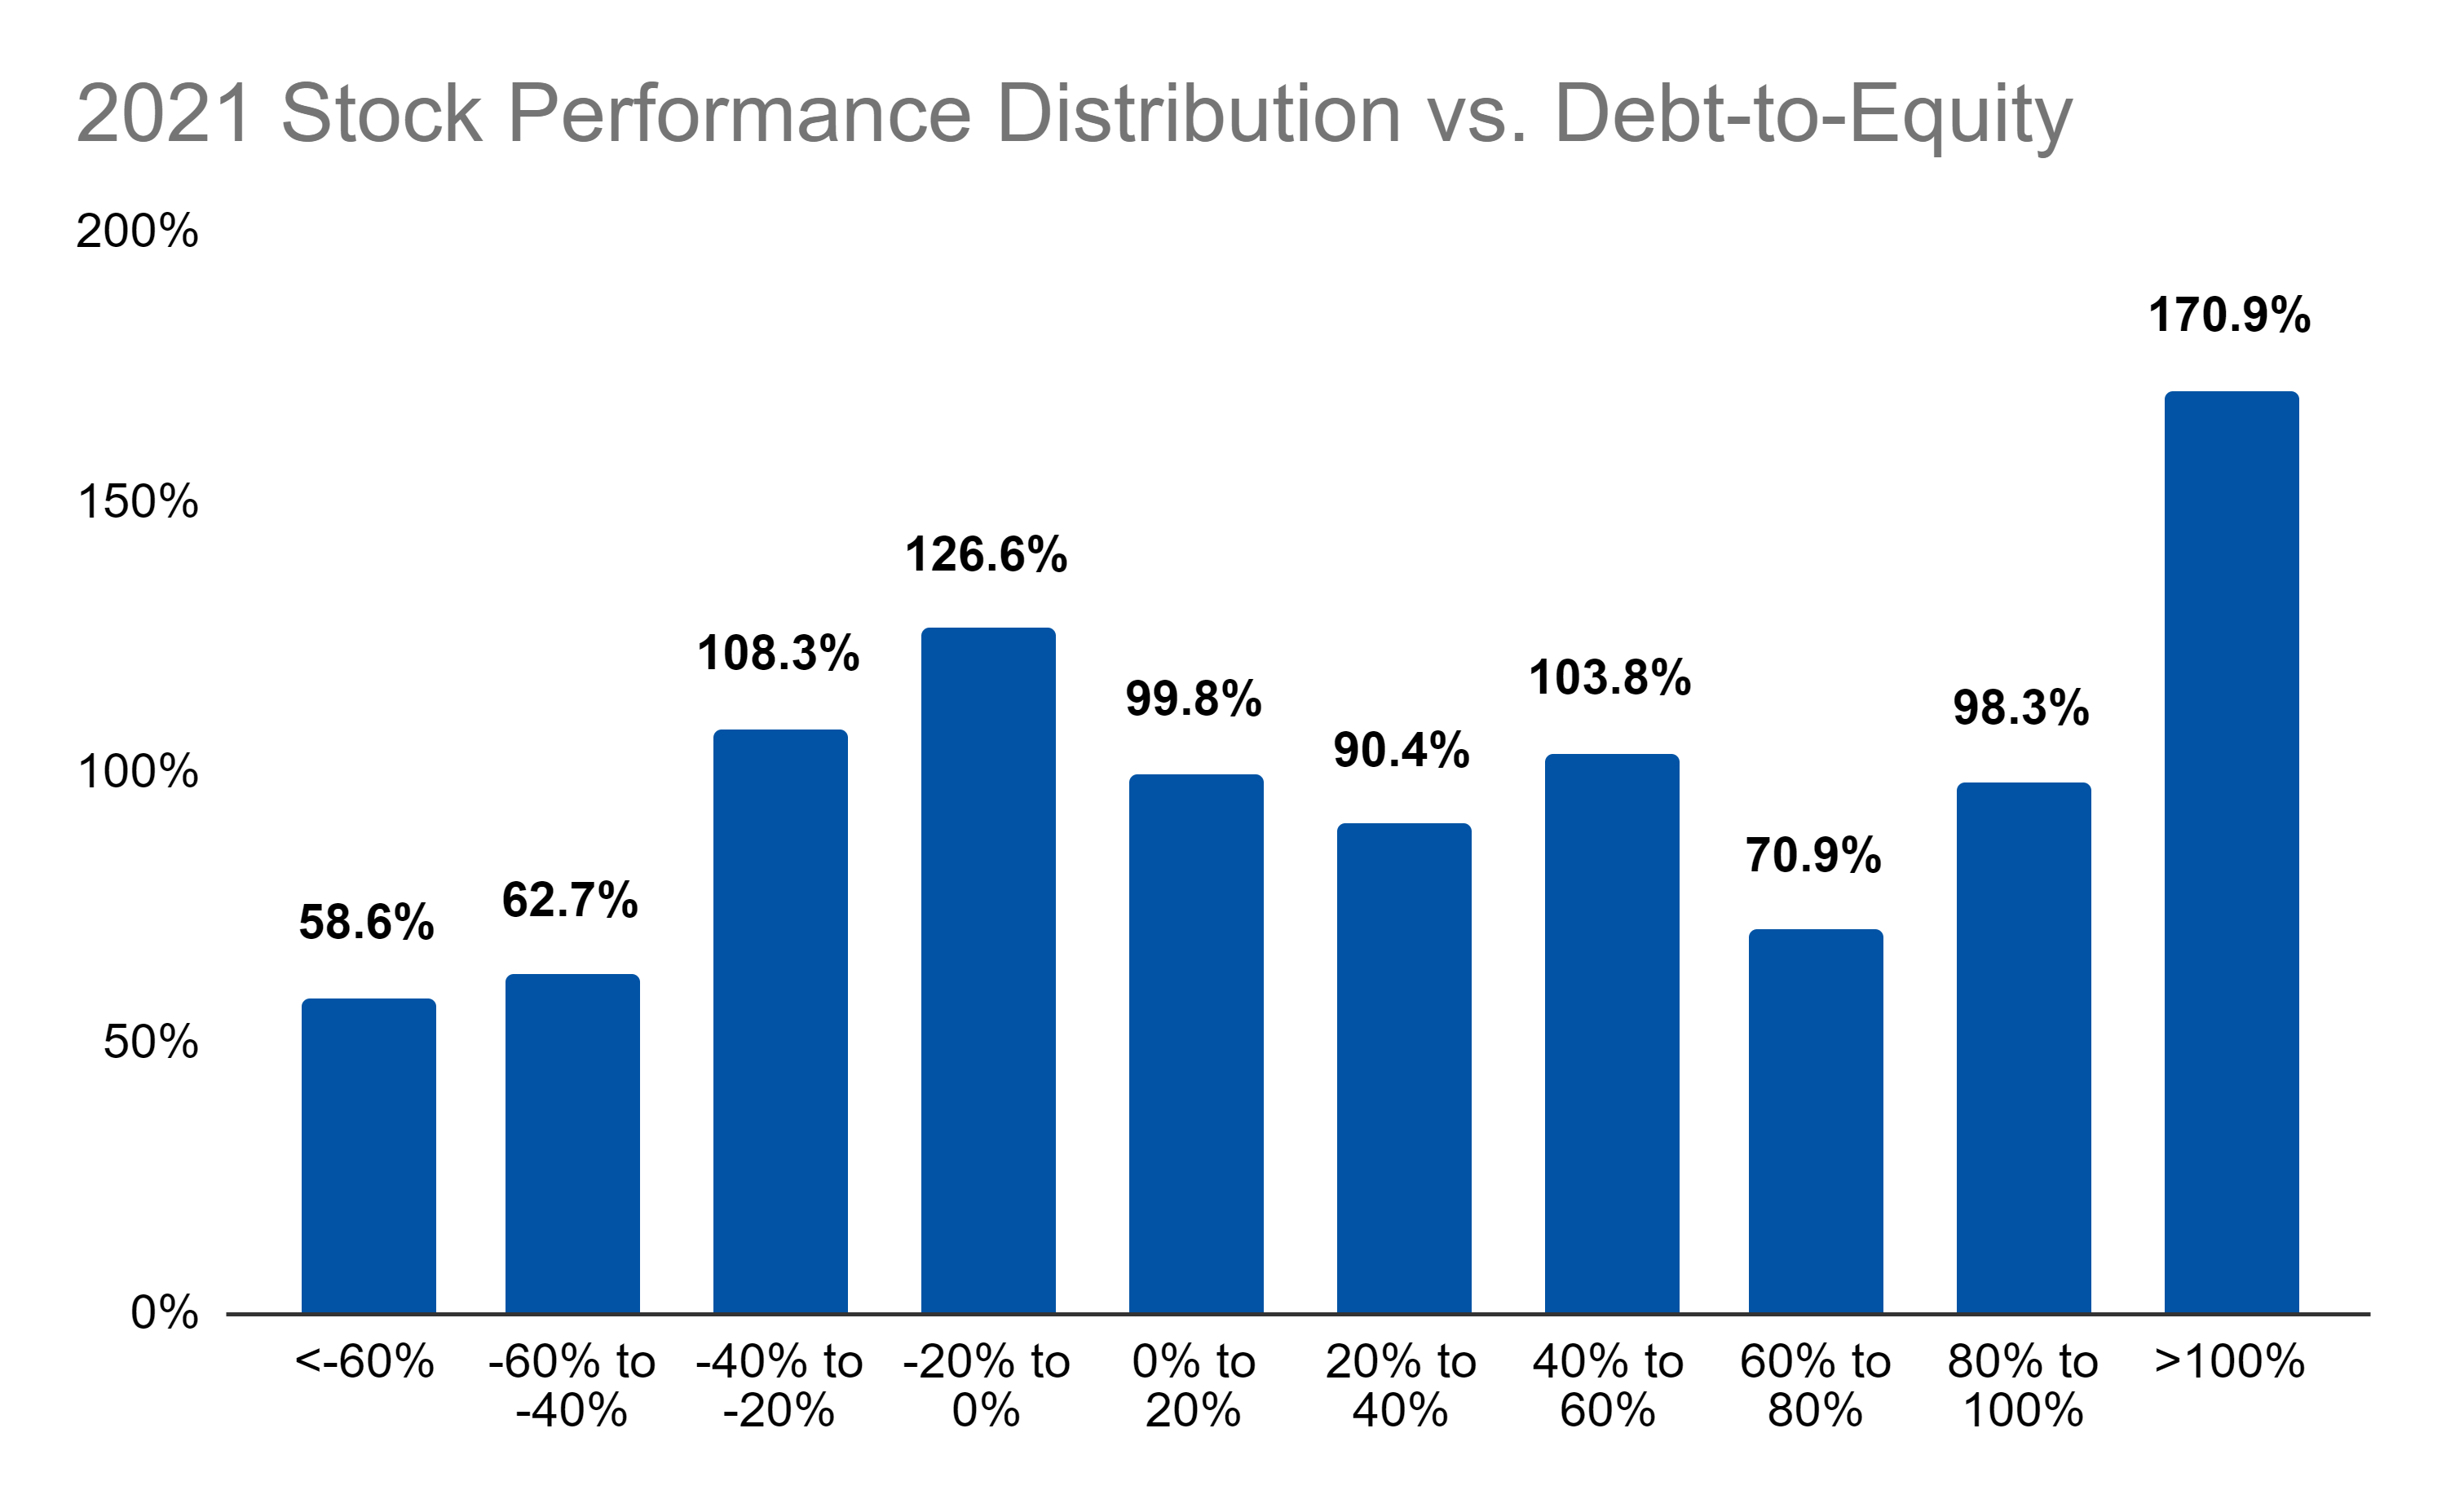
Before I made this chart, I might have expected to see higher leverage on the left and right of the chart. That is, companies that do both good and bad might have high leverage since it tends to amplify results of winners and losers. But, really, it’s just in the highest performers that we see the most leverage.
Here’s another metric for leverage - the assets-to-equity ratio:

Again, we see relative more leverage in the winners. But, this time, we also see a bulge in the middle performers as well.
Overall, the takeaway is a little bit weaker from these two metrics but we could say something like, “it appears that, generally, stocks with higher leverage tend toward higher returns.” This is by no means a hard and fast rule but just a general rule of thumb to help us remember what we are looking for in our research.
Links
Most Popular Posts | All Historical Posts | Main Site | EM100 | EM1000