
Year-to-date ETF Performance
A look at the bigger picture for the big ETFs
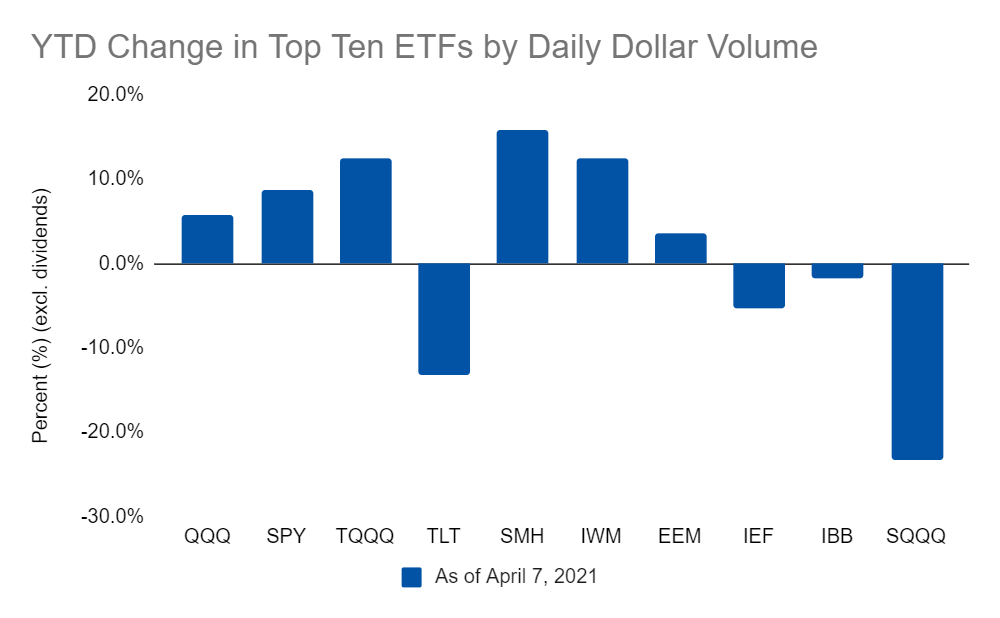
Just made an update to the collection of 1000 popular ETF's by adding the year-to-date performance for all of the funds.
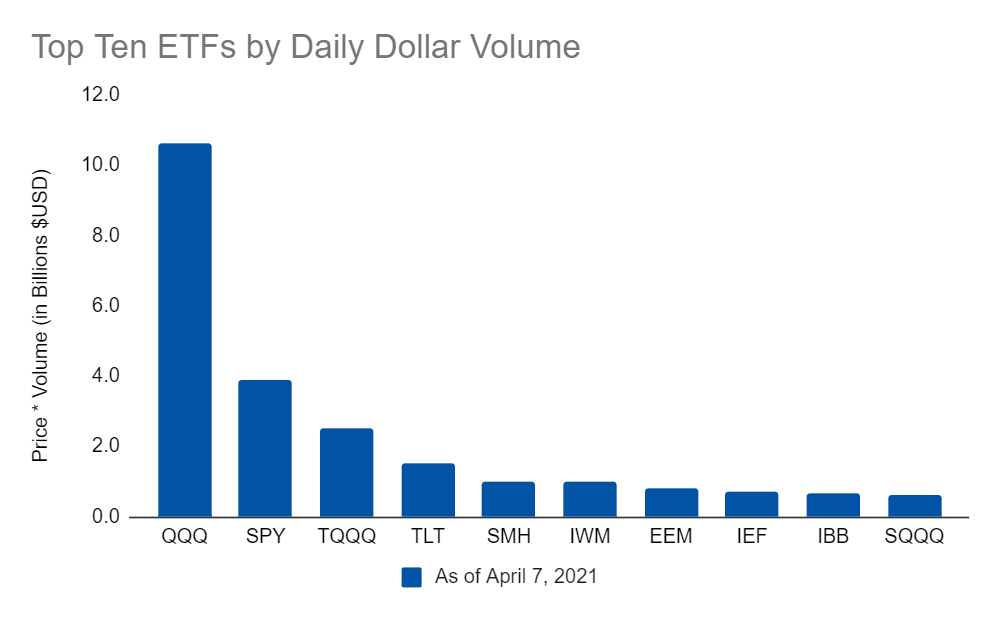
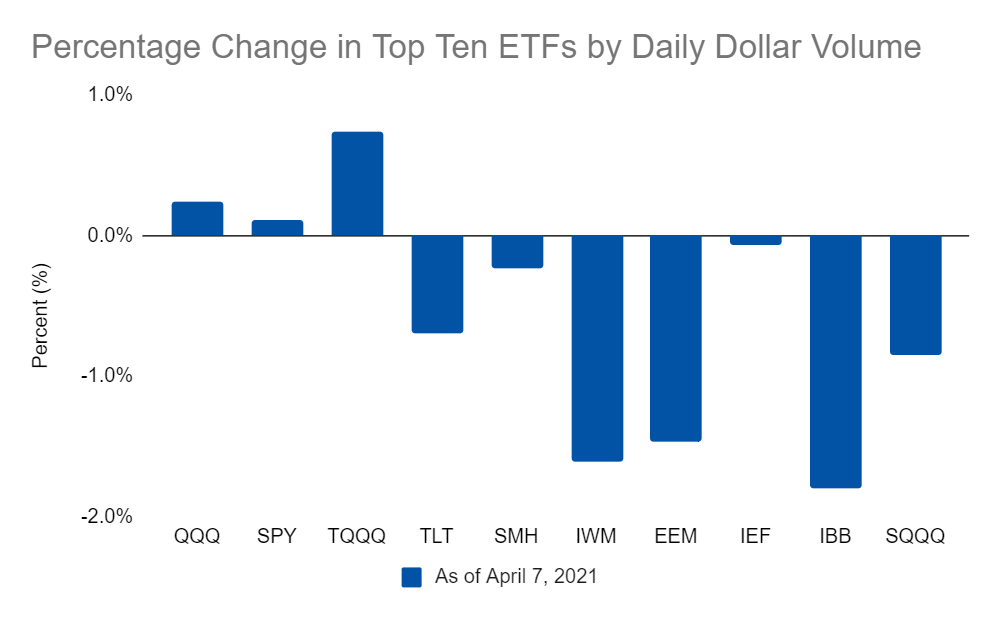
By adding this, I can now add an additional chart to the daily ETF section that shows how the largest volume funds are performing beyond just one trading day’s change. Check it out below!
Daily ETF Update
Links
Yesterday’s Post | Most Popular Posts | All Historical Posts | Contact
Tracking Portfolios
Overall Comparison | Wild Stuff - Chart | Shiny Stuff - Chart | Safe Stuff - Chart | Big Stuff - Chart | Random Stuff - Chart
Live Charts
Ten-Year Treasury Less Two-Year Treasury | Ten-Year Breakeven Inflation Rate | S&P 500 | S&P Rolling All-Time High | S&P 500 Drawdown | S&P 500 Rogue Wave Indicator | S&P 500 Moving Averages | S&P 500 / 200-Day Moving Average | S&P 500 / 50-Day Moving Average | S&P 500 50-Day Moving Average / 200-Day Moving Average | S&P 500 Relative Strength Index | CBOE Volatility Index (VIX) | Three-Month USD LIBOR | Three-Month Treasury Bill (Secondary Rate) | TED Spread | Price of Bitcoin | Bitcoin Rolling All-Time High | Bitcoin Drawdown | Bitcoin Rogue Wave Indicator | Nasdaq Composite Index | Nasdaq Composite All-Time High | Nasdaq Composite Drawdown | Nasdaq Composite Wave Indicator | Nasdaq Composite Moving Averages | Nasdaq Composite / 200-Day Moving Average | Nasdaq Composite / 50-Day Moving Average | Nasdaq Composite 50-Day Moving Average / 200-Day Moving Average | Nasdaq Composite Relative Strength Index | Moody's Seasoned Aaa Corporate Bond Yield | Moody's Seasoned Baa Corporate Bond Yield | Moody’s Aaa less Baa Corporate Bond Yield | Dow Jones Industrial Average | Dow Jones Transportation Average | Dow Jones Industrial Average / Transportation Average