

Oil and ExxonMobil
Oil and ExxonMobil
When a company is driven by a commodity
In 2008, ExxonMobil (XOM) had the largest market capitalization of any company in the entire stock market. Lately, it’s been hovering around the 40th-50th largest in the S&P 500 and that’s after a pretty big rally the last few weeks.
The story of ExxonMobil is really a story of oil prices, which had been in a meteoric rise in the decade prior to 2008 (which anyone buying gas at the time should remember). Compare the price of oil with Exxon’s revenue:
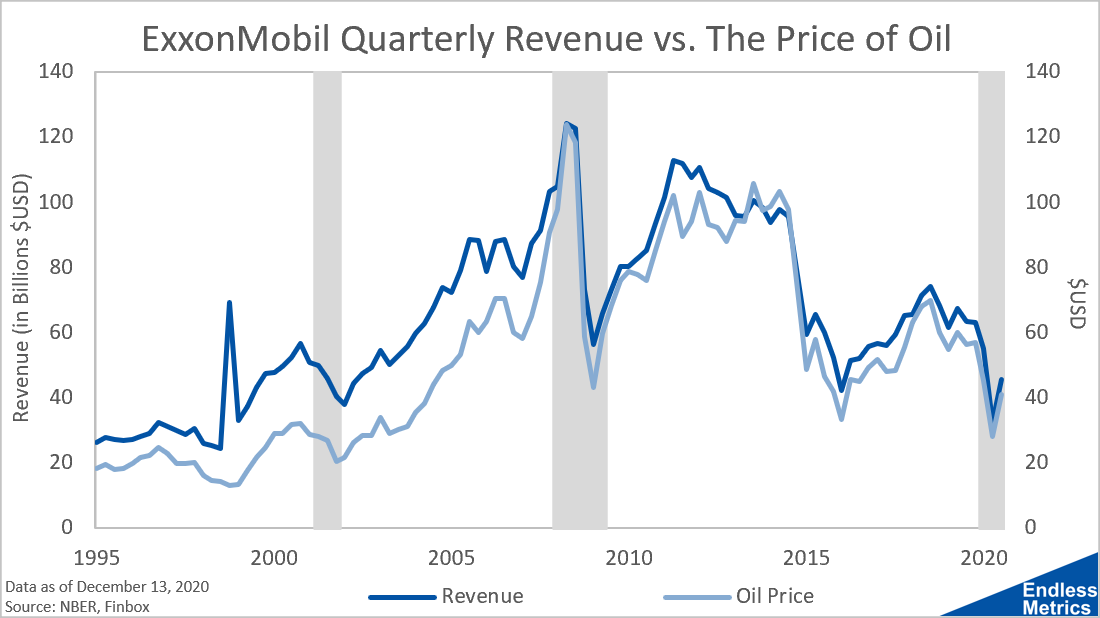
Pretty darn similar.
Here’s a company that was taking in hundreds of billions in revenue every quarter at its peak. Yet, despite maybe some fancy ads highlighting their progressiveness when it comes to “clean” energy, has had no meaningful divergence from oil to show for all that money. Talk about a lack of innovation.
Now, you might think, tens of billions in revenue is still really good! And, that’s true. But, unfortunately for Exxon, investors also care about the bottom line and how much of that revenue ends up as earnings per share. That has been an ugly downtrend for many years:
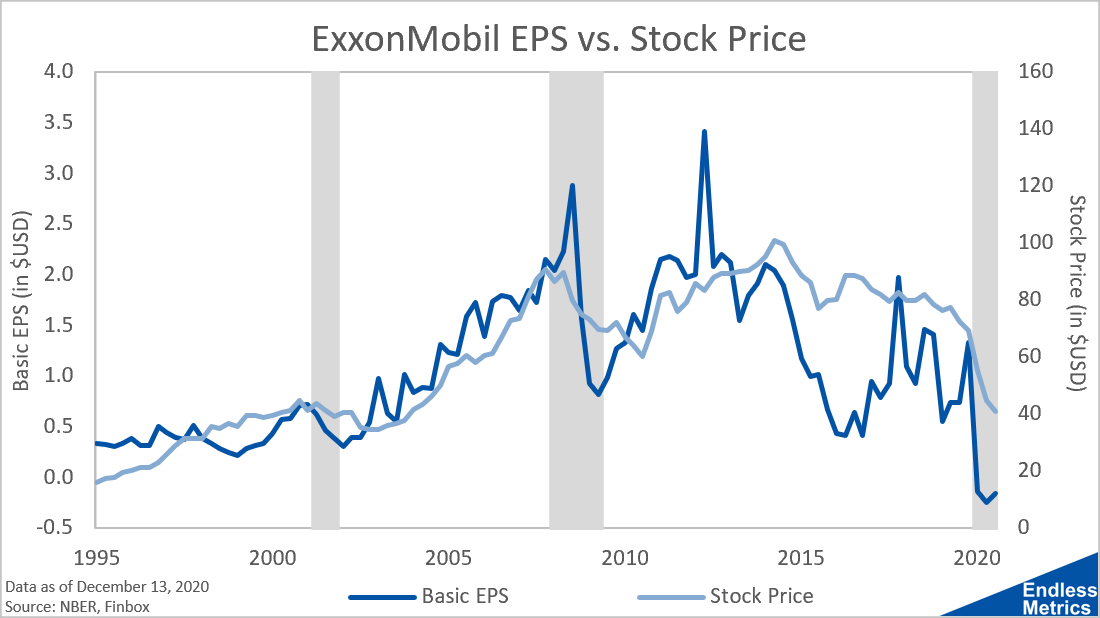
While this stock is still popular for those looking for dividends, which aren’t reflected here, it’s hard to see this ugliness and wonder why the stock price is even where it’s at. Then again, a basically zero percent change in price over fifteen years when the rest of the market has gone to the moon and back is probably pain enough for Exxon’s remaining believers.
Daily Stock Highlight

Links
Yesterday’s Post | Most Popular Posts of All Time | All Historical Posts | Contact
Hi Luke, nice analysis! Can you elaborate on what a negative "forward price / earnings" means? You can do it here if it's not much trouble or in a future newsletter post.