
Optimal Portfolios
Comparing time periods
If we know how much return we want, we can find the optimal portfolio allocation that minimizes our risk. Here is what that looked like for the simple investment cheat sheet from May 2013 - August 2020:
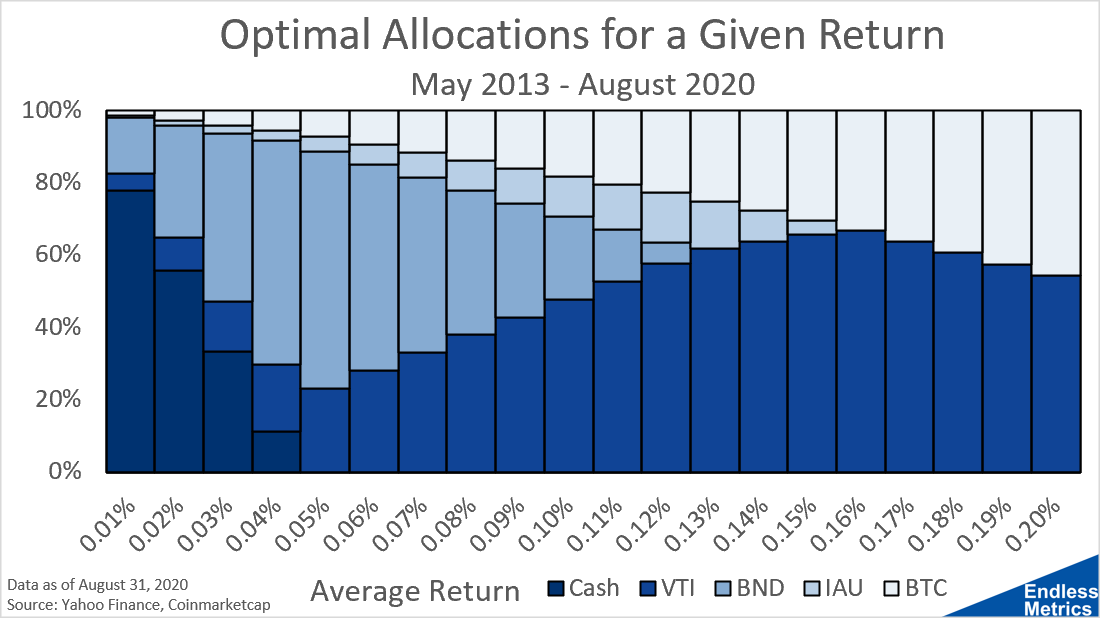
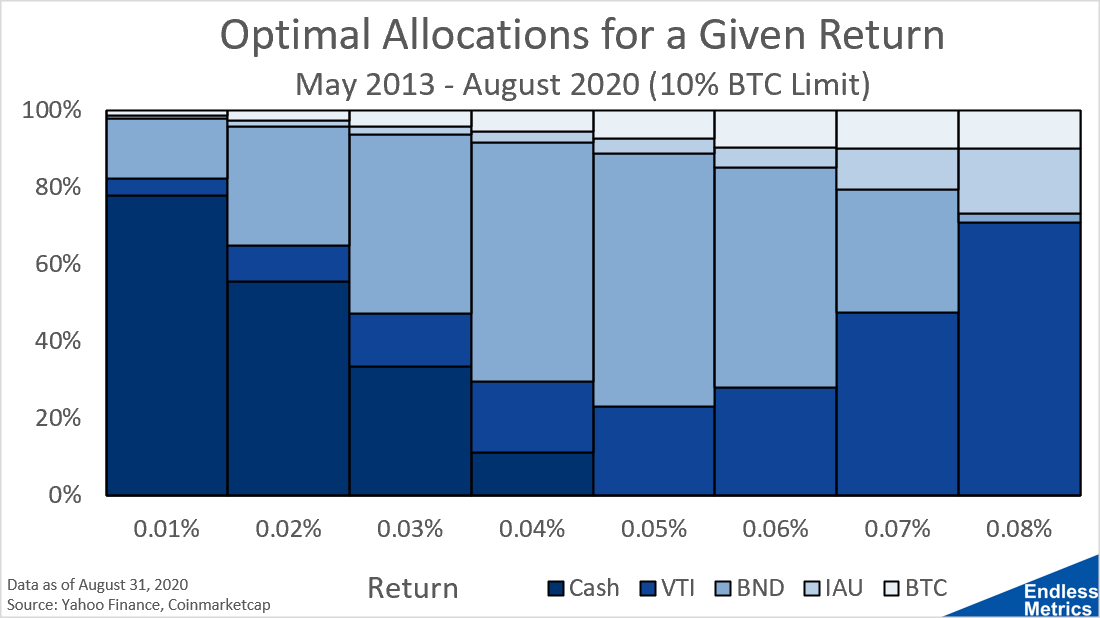
The problem is, we probably don’t want to hold that much Bitcoin. So, if we set a limit of 10% Bitcoin allocation to our portfolio, the allocation changes and the upper bound of possible returns is reduced:
But, what if we want a longer time period than just the last seven years? If we go back to May 2007, we have to remove Bitcoin as an investment because it wasn’t invented yet. Here is what that looks like:
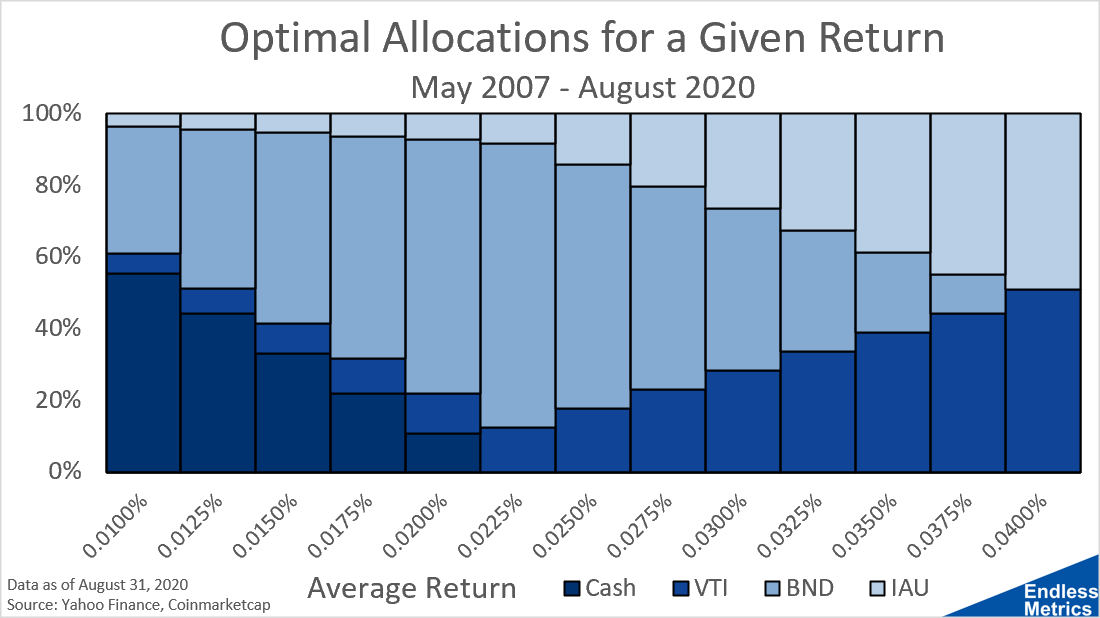
The first thing I noticed is that the upper bound of average return is so much lower than when we had a shorter time period and could add some Bitcoin. Additionally, capturing the Financial Crisis hurts our returns. I would argue though, that it provides a better benchmark for us to consider our investments because bad market crashes and recessions do happen! We should be realistic when we determine our historical period and capture those business cycles.
The other thing I noticed was that real estate exposure was once again zero! It has never had a single percentage of allocation in any of the three optimal portfolio analyses.
Finally, I thought it was interesting that, in general, the way the portfolio allocations change as the return increases is very similar. You start with a lot of cash, then go to bonds, end up with stocks, and have some gold in the middle. The May 2007 - August 2020 period has a lot of gold since it did so well over that time but the evolution looks similar even if the allocation is larger.
So, we are starting to see some patterns for how we might want to build our portfolio. The challenge is, how much return do we want? We will look for an answer to that next.