


Picking Random Stocks
How does a blind guessing strategy perform?
In 2021, the S&P 500 index rose from 3,756.07 to 4,766.18 for an annual gain of 26.9%. That’s a great year for the market. But, how did individual stocks do? Looking at a sample of 6,002 individual companies over the year, only 1,781 performed better than a 26.9% return:

So, if you were to pick one of those stocks at random, the odds that it would have underperformed the S&P 500 is a (surprisingly large) 70%:

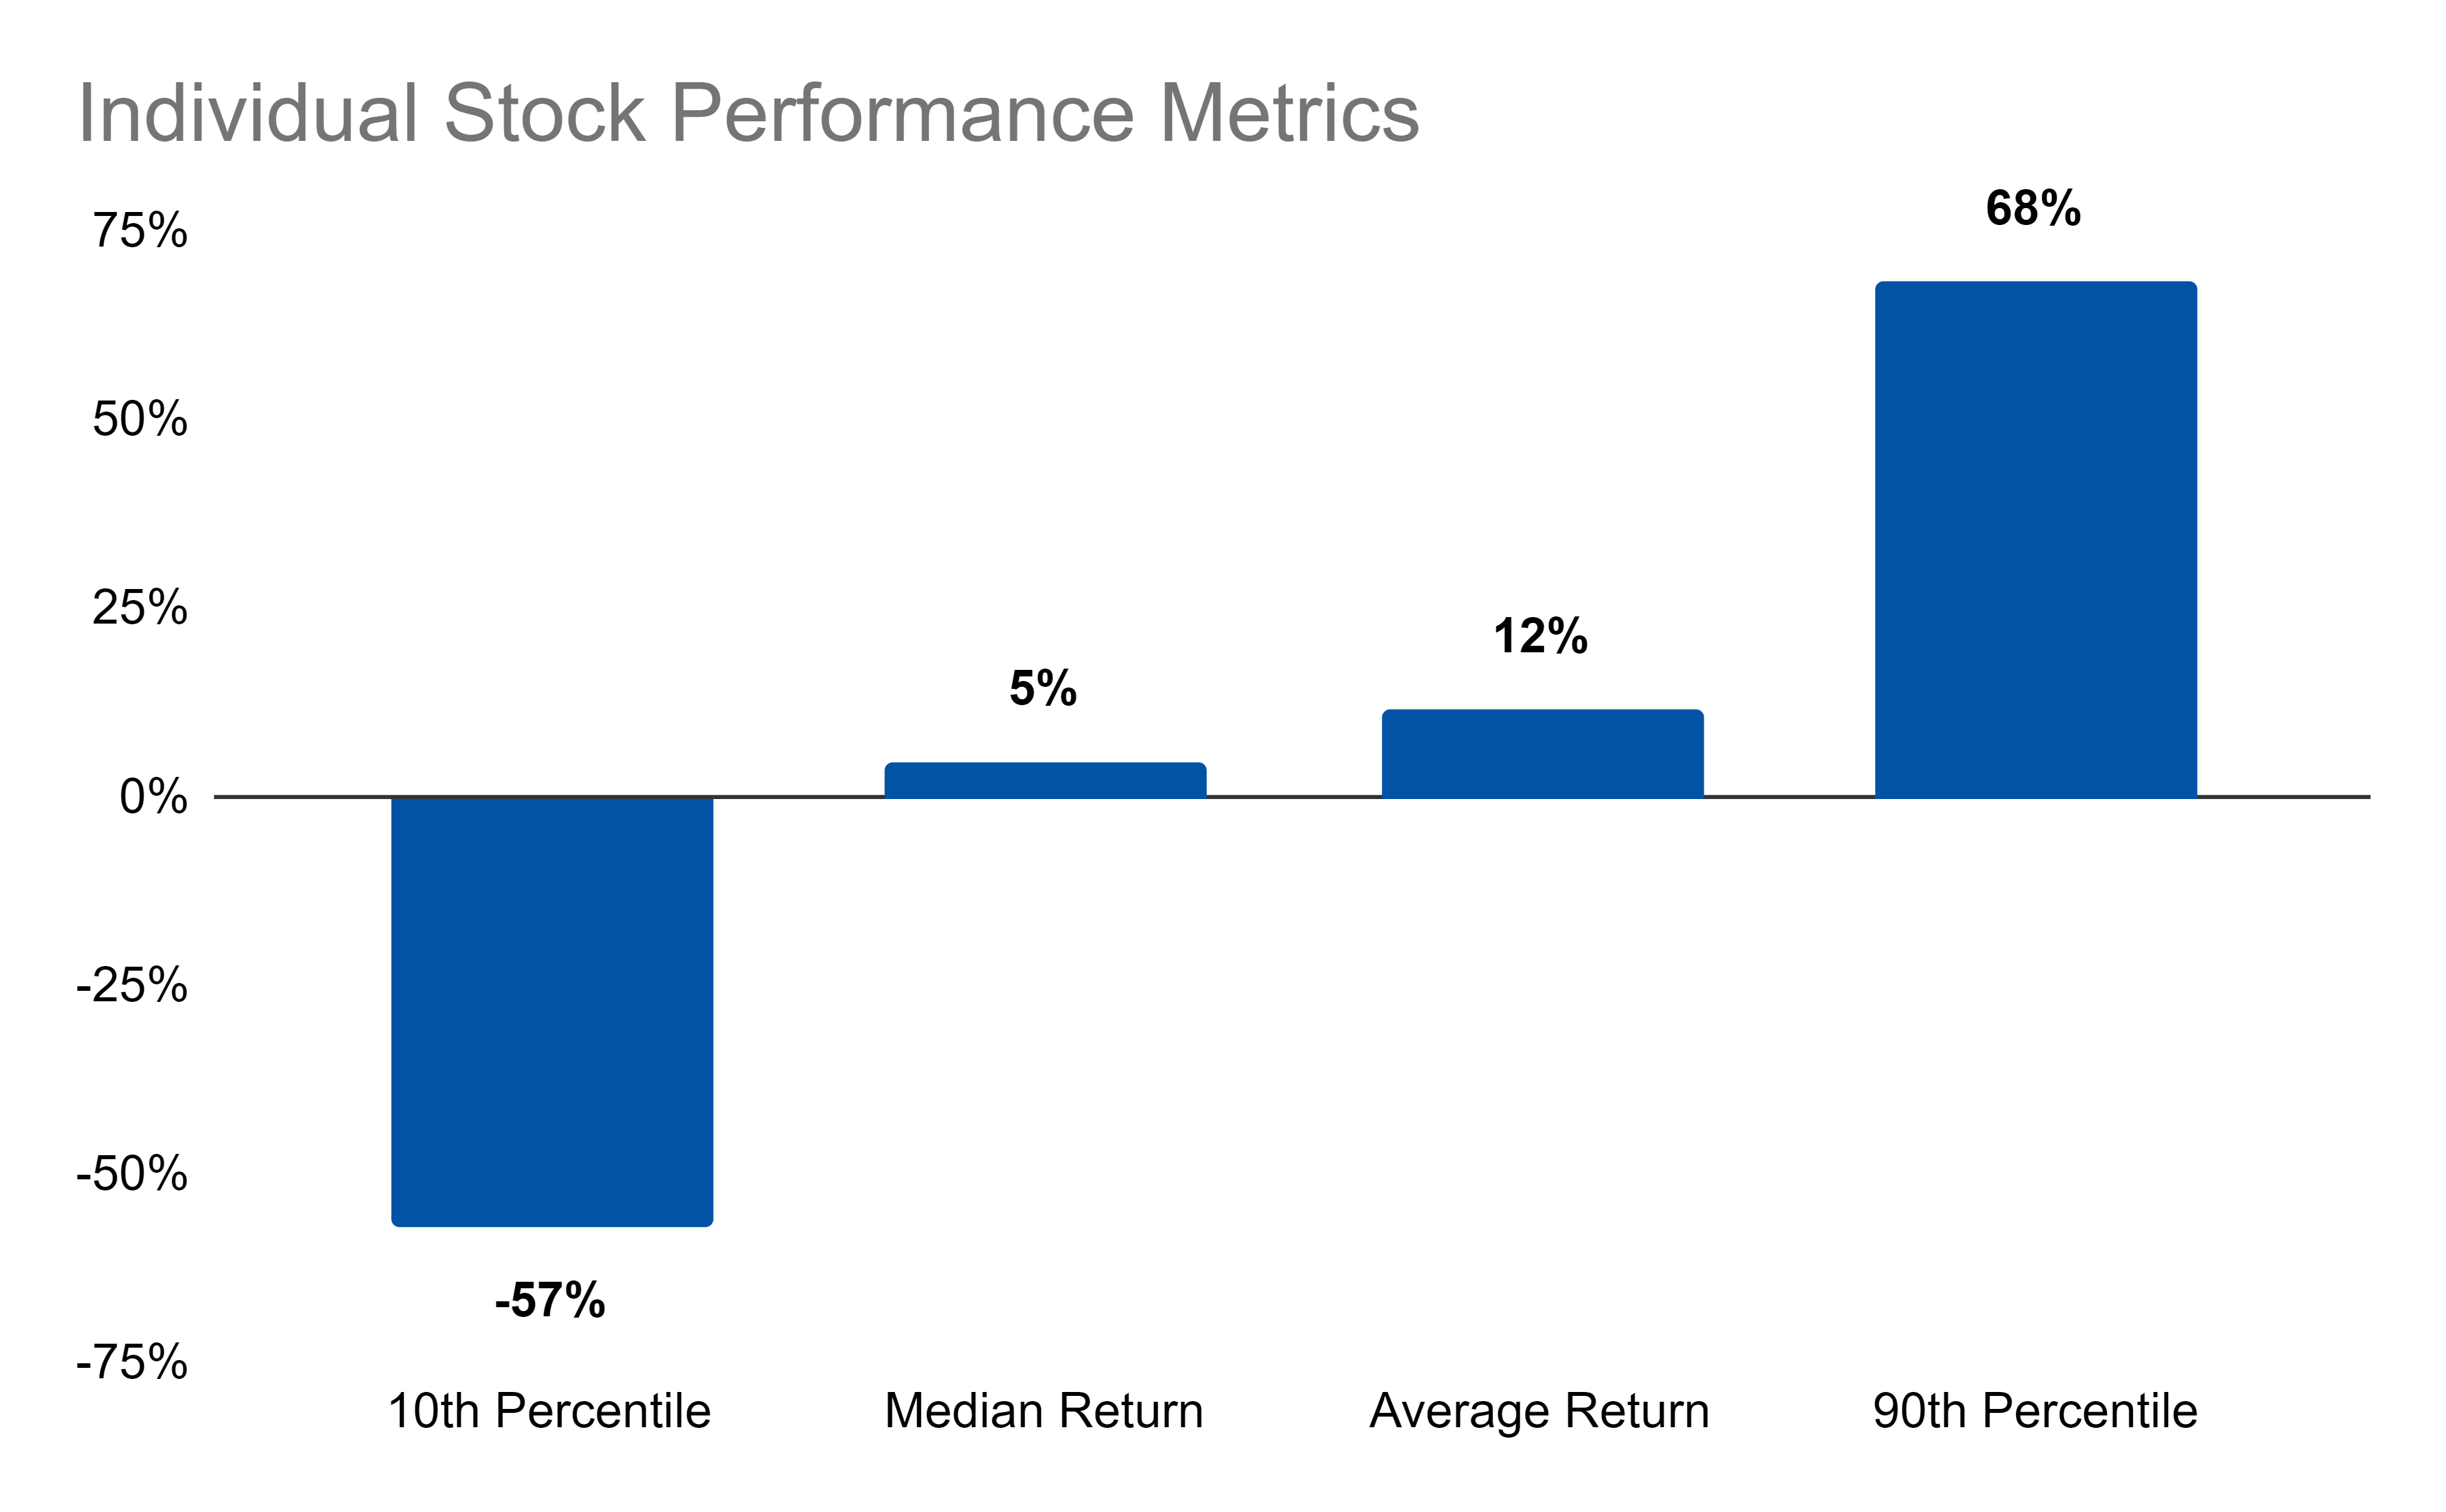
If you picked a stock in the lower 10th percentile of performers, you would have lost -57%. In the upper 90th percentile, though, you would have made 68%. In the middle, whether you choose median or average, your results are more mundane at 5% and 12%, respectively:
Most people, however, don’t invest in just one stock. But, if you were to just pick at random with only 30% odds of beating the S&P 500, then the more stocks you invest in the lower your odds of outperforming the S&P 500:

And, in a funny result, your average performance doesn’t really change:

However, your median portfolio performance increases:

And, your downside chances of really messing up and losing a lot of money, diminishes greatly:

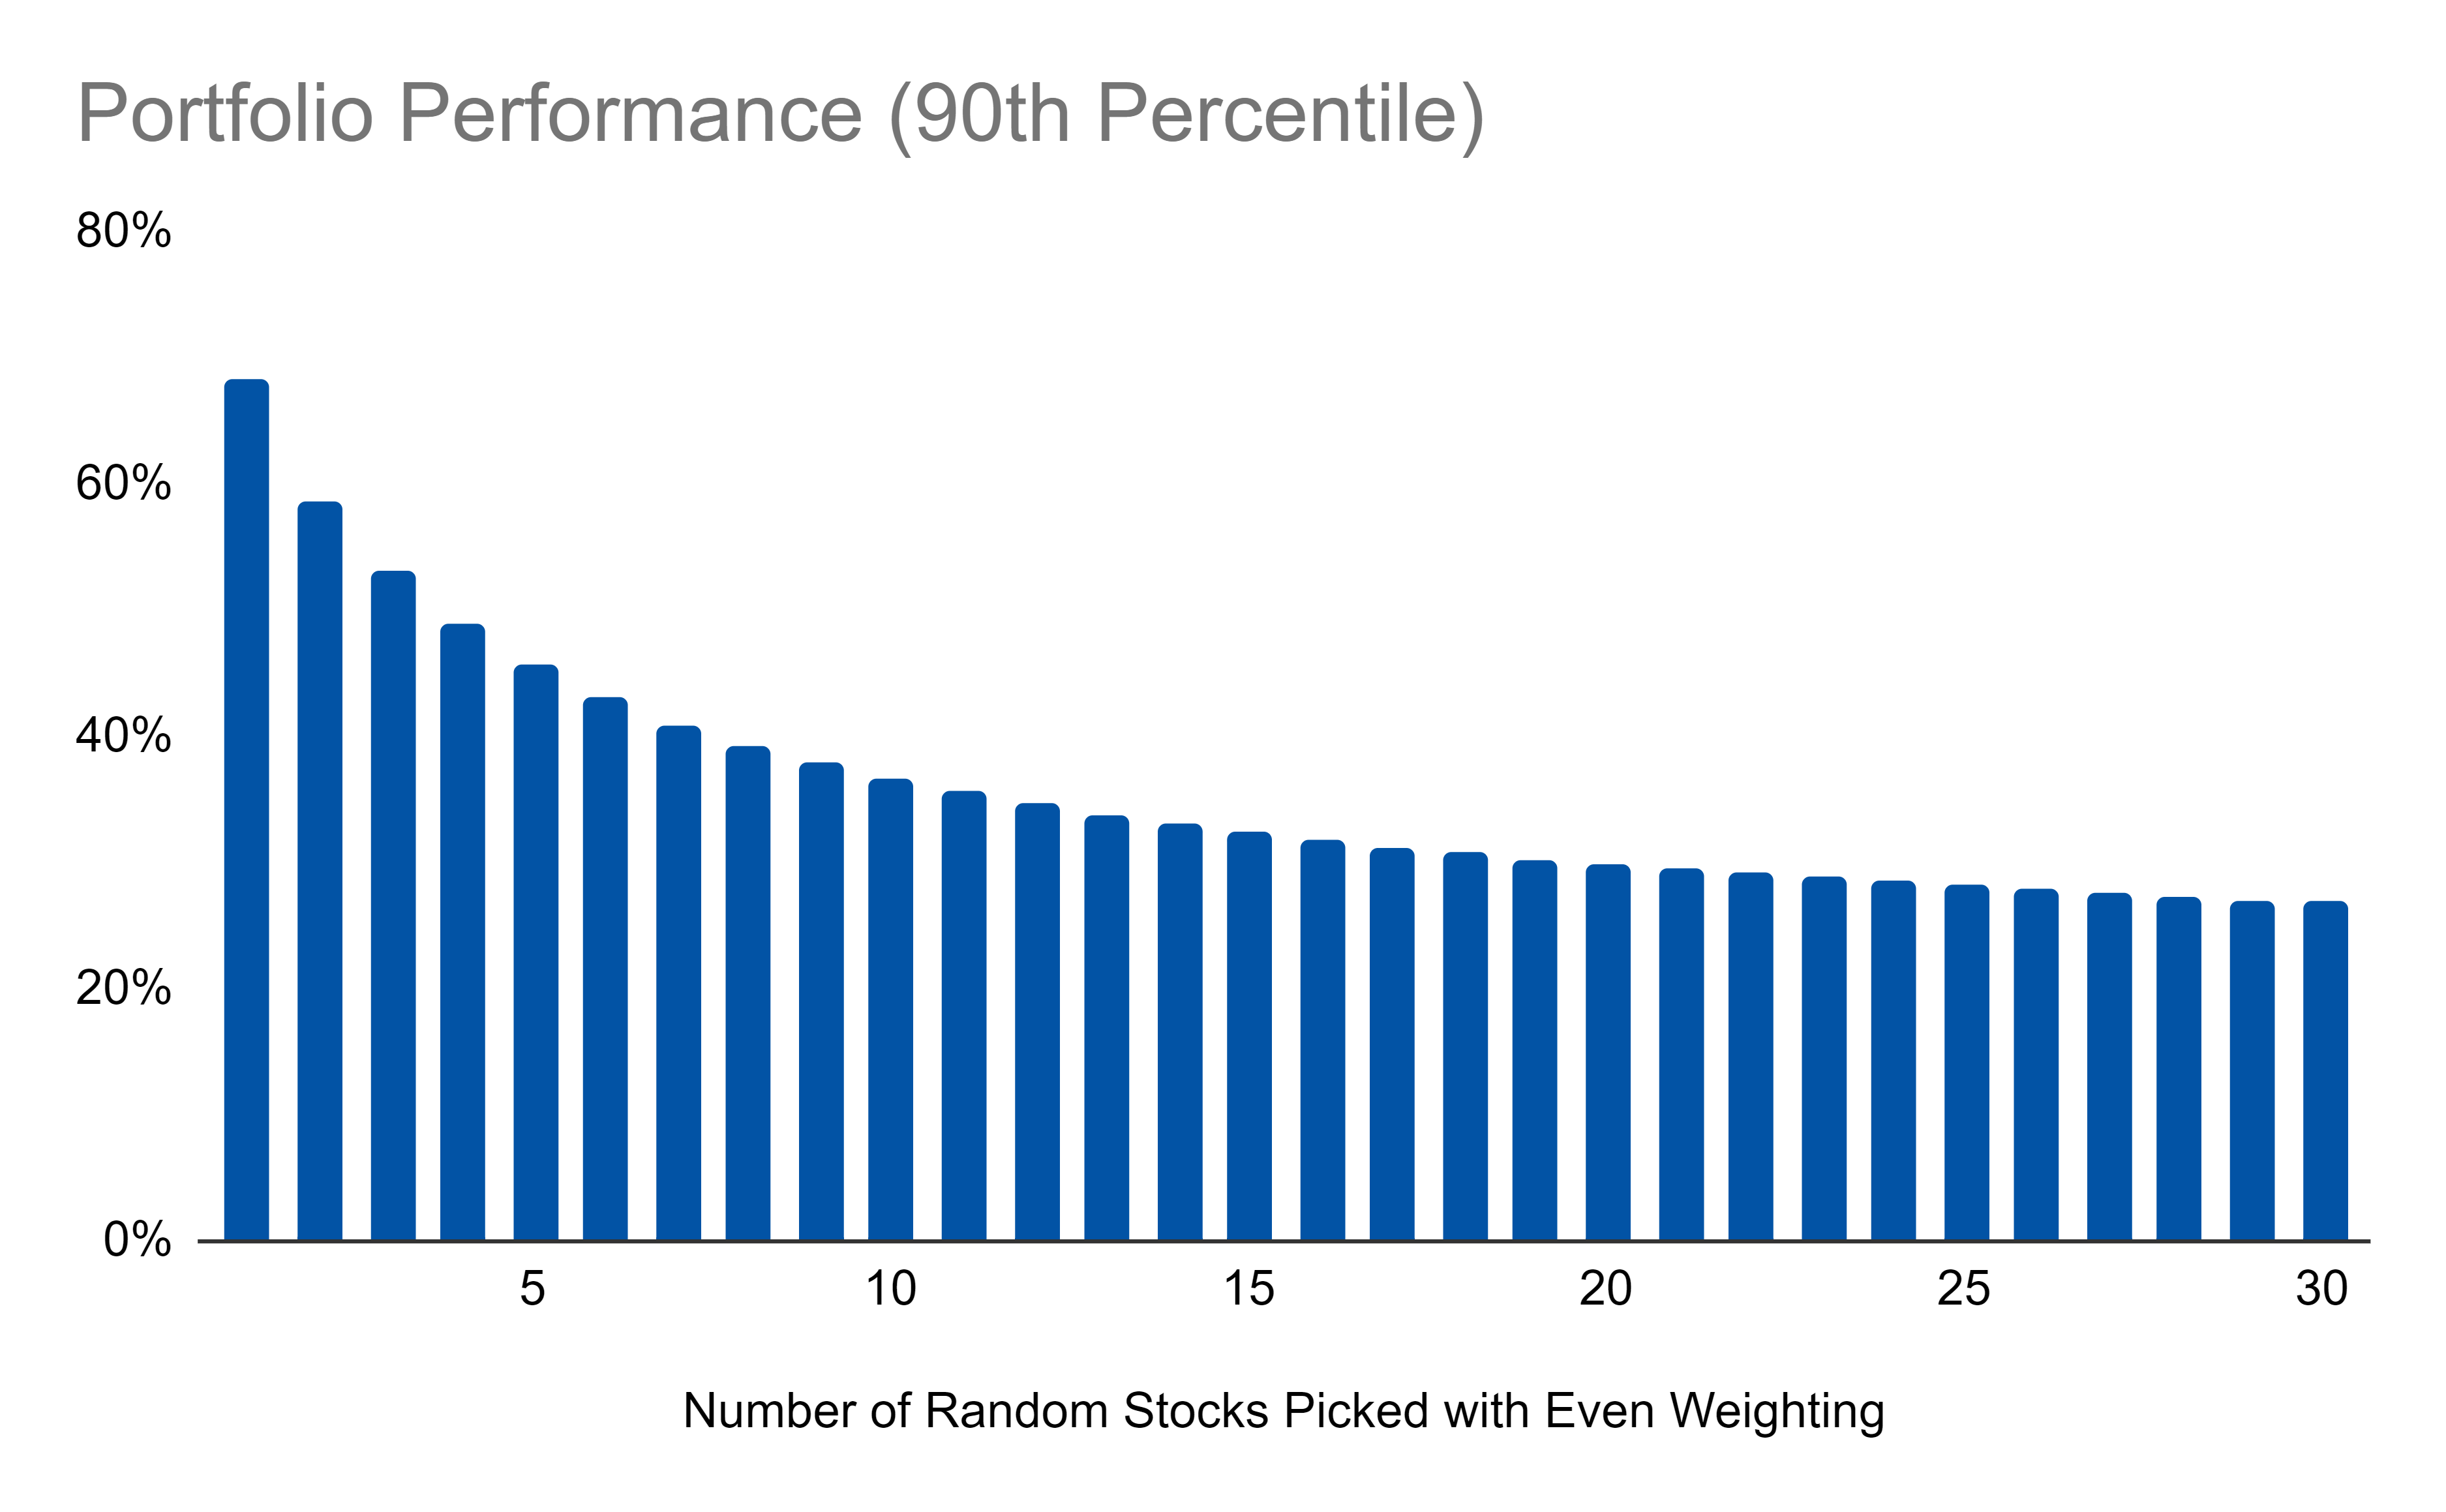
The cost of this downside diversification benefit is loss of upside:
Now, all of this is interesting but it presupposes we choose just any random stocks. These stocks could be companies that are profitable, unprofitable, big, small, growing, shrinking, or any number of things.
To expand the sophistication of this analysis, we will do some more work in the coming days to better understand how this kind of approach looks for companies in the S&P 500 itself, for ETFs (that one would hope are choosing somewhat better since they are developed by sophisticated investment firms that charge fees) and, generally, what metrics look like for companies that have outperformed or underperformed this past year.
Links
Most Popular Posts | All Historical Posts | Main Site | EM100 | EM1000