
Randomly Forecasting the S&P 500
A random walk
So, I said yesterday that I was going to write about the material components of wages and salaries in this post…but then I got distracted making this random walk calculator after work today. Here’s what a sample of ten of these forecasts looks like:
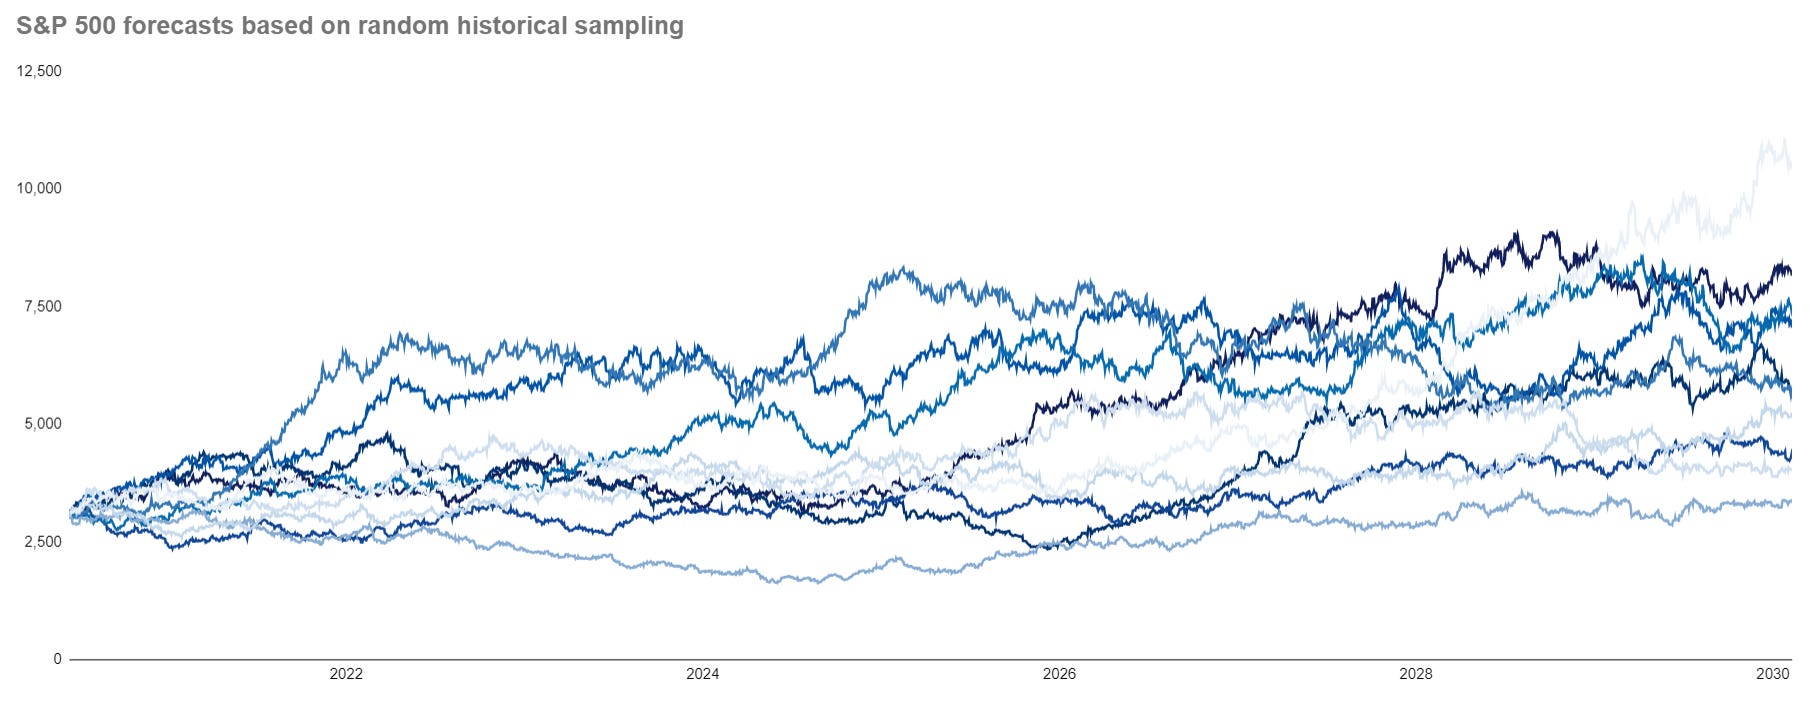
Now, I talk a lot about the future being impossible to predict. So, what’s the value in making a bunch of random forecasts? In this case, I’d say that it’s the power of visualizing the long-term impact of a drift on a randomized series.
More simply, the market on average is expected to go up a tiny bit each day. So, even though there are dips, crashes, and recessionary periods, over the long-term, there is an upward bias that will give it a positive trend. That small bias compounds over time and creates huge increases in the index.
For me, seeing these random walks also eases some of the anxiety that comes along with investing. When you are risk averse and don’t like losing money, it’s scary to invest. But, if you take random samples of what has happened in the past and apply it going forward, the most likely outcome is positive.
In fact, investing could be incredibly lucrative as many periods in the market’s history have seen 200-300% gains over ten years. That outcome for 2030 seems impossible to me in theory given everything going on but, chances are, the S&P 500 will do better than most people think.
All that being said, if you want to see the forecasts in action, you can use the following link: