
Simple Investment Correlation Matrix
Quantifying diversification
Let’s take a look at our simple investment cheat sheet from another angle:
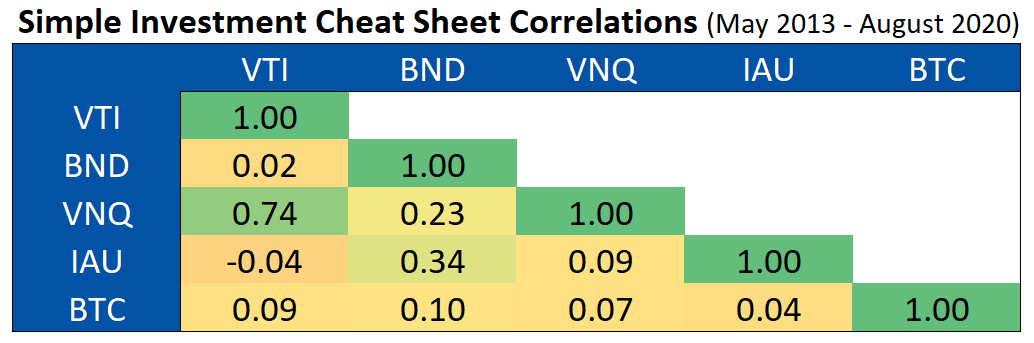
This matrix assesses the correlation between each investment against the others. The reason cash isn’t included is because it’s returns are flat at zero, so the formulas break. Taking that out, we have five investments left to compare
Correlation runs between -1 and 1 and the further away two investments are from 1, the more benefit you get from diversification. The simplest non-math way to explain it is if you invested in a sunscreen company and an umbrella company. You get coverage for both rainy days and cloudy days and when one company sells product on a given day the other may not sell as much product. But, by owning both, you get better performance balance by having diversification from an overall portfolio perspective.
If you look at the matrix above, most of the correlations are close to zero except for VTI and VNQ. That’s the power of totally different investment categories - you can find a lot of performance diversification and that will reduce your risk.
This analysis perspective will also be really useful when we assess new investments to add into the framework. If we find something that has high correlation to everything else or even a few investments, then we may ask ourselves if it even makes sense to add. If we find something with really low correlation, then we may want to allocate a good bit to it so we can take advantage of the diversification benefits. But, we still have some more tools to look at before we start assessing new investment options. Stay tuned!