


Stock Prices, Shares Outstanding, and Market Capitalization
When price just ain't enough
The most widely-known metric about a publicly traded company is the stock price. It’s readily available, makes all the headlines when it changes a lot, and is the ultimate reason people make money on their investments (or not).
Stock prices are extremely high-frequency data series, which is unlike most underlying fundamental company data (e.g., balance sheets, income statements, cash flows). So, to continue with our Apple example, we want to convert price into some format we can use alongside quarterly data:
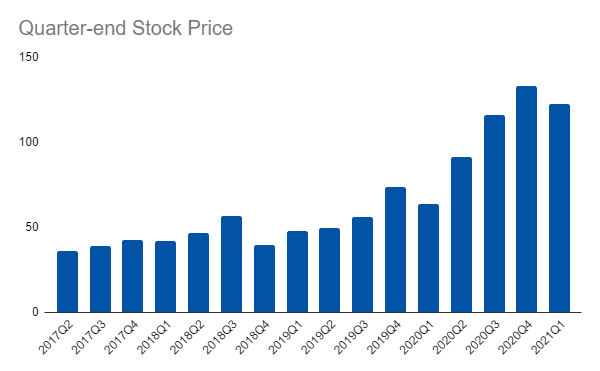
The problem with price is that it’s meaningless when compared in nominal terms to other stocks. If one company has shares trading at $20 and another has shares trading at $200, which company is a better investment? For new investors, and even old ones who fall into the mental trap of relative “cheapness” of a stock, the $20 stock might seem like a better deal. After all, we are used to shopping around for the cheapest deals to save money.
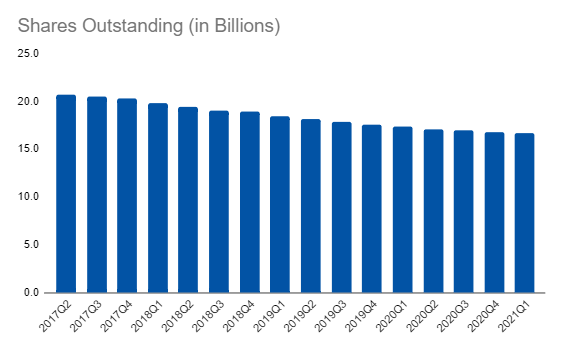
But, shares represent ownership in a company. If you had one share of Apple, and you knew there were only 99 shares available to buy, you’d be pretty happy because you would own a big chunk of the company. Sadly, there are billions of shares of Apple out there:
If we want to get a good metric to understand “better deals” in terms of how big a portion of a company we can purchase by buying some shares, we need to multiply price by the number of shares available to get market capitalization. Here’s what Apple’s looks like when you multiply the previous two charts:
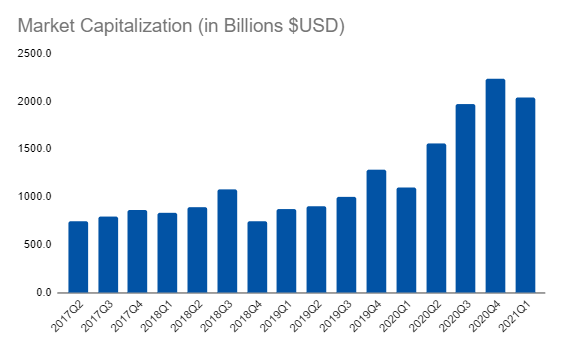
Market capitalization allows us to do something really powerful - compare the market value of a company to its financial statements. If we know that Apple is making billions of dollars, we can’t really compare that to the stock price because the stock price is essentially arbitrary. What if Apple did a stock split the next day and caused all of our metrics to change? Further, our metric’s couldn’t be compared to other companies who have essentially arbitrary stock prices themselves.
We can fix this with market capitalization. We can get the size of every company out there and compare them. Then, we can use that comparability to standardize certain financial metrics. This allows us to answer a lot of important questions when comparing potential investments. And, we’ll be looking at the most popular of these comparable metrics in the next post!
Links
Yesterday’s Post | Most Popular Posts | All Historical Posts | Main Site | Contact