

That was the fastest market correction ever
That was the fastest market correction ever
It took 6 trading days to go from an all-time high to down more than -10%
Yesterday morning, I started thinking about how unusually fast the market has fallen over the last few days. So, I did some quick analysis and realized that if the S&P 500 fell to 3047 or below it would indicate not only a market correction of -10% down but also mark the fastest drop from an all-time high to a correction. I actually thought I did the calculations incorrectly because I couldn’t really believe it.
When the market rebounded mid-day, I figured I’d have to shelve the idea. Then I got busy and didn’t see the absolute bloodbath that happened in the afternoon until after the market closed.
Unfortunately, once trading stopped for the day everyone started writing about how it was the fastest correction ever! Darn it! Here I was thinking I had a cool, special idea. Fortunately, looking through the analysis other people had done I was able to confirm that I had actually done the original analysis correctly. Though, it still seems unbelievable to me.
Maybe that’s a rambling personal story you don’t care about. So, let’s get to the chart:
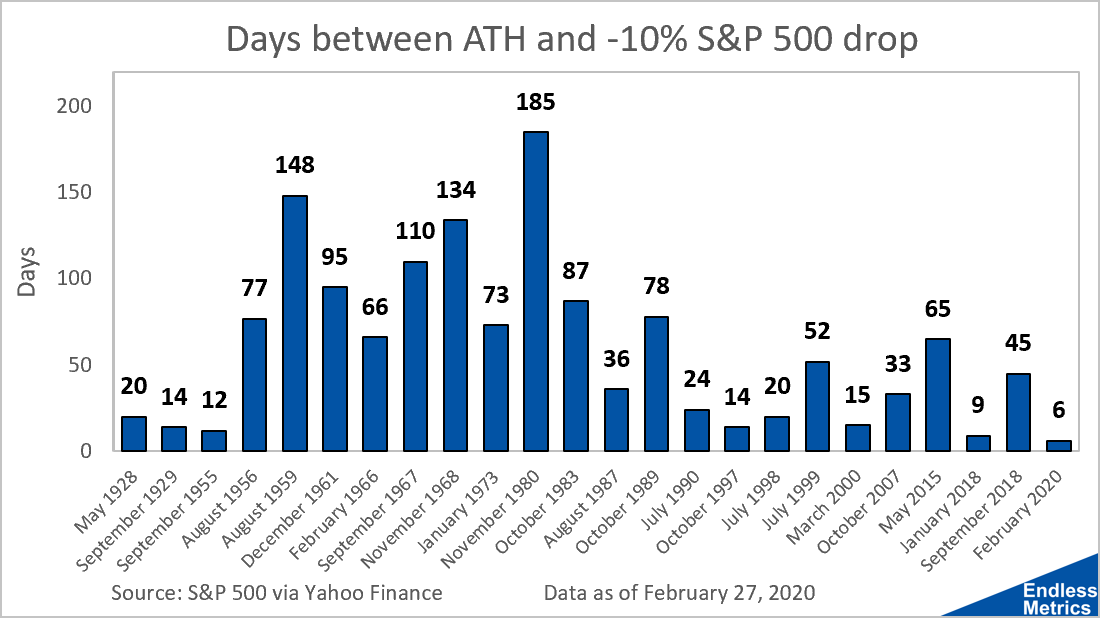
I saw one version of this chart yesterday that rank-ordered the drops from least days to most days but I like this version better because I think a timeline is more intuitive. The first thing I really noticed though was the huge discrepancy between the various time periods. It is surprising that the market had such a long span between 1956 and 1983 with no quick drops. Since then, when the market falls it happens fast! I guess an easy speculation would be the proliferation of algorithmic trading since the 1980s. Though, I guess that doesn’t explain the quick drops before 1956.
In other news, the loss over the last four trading days is also pretty historic. It was a 0.23% tail event but two-thirds of the other events were during the Great Depression and the Financial Crisis so it’s actually more unexpected than the percentage might indicate. After doing articles about the one-day loss and the two-day loss, I’ll save you the repetitiveness of doing another for the four-day loss because the bottom line is that we haven’t seen something like this since 2008. Oh, and this two-day loss also exceeds the two-day loss from Tuesday!
Basically, there is a lot of selling going on right now and, depending on how you measure it, we haven’t seen losses like this since the Financial Crisis. It seems the uncertainty is getting priced in all at once since the trajectory of the outbreak and potential for it to cause a recession remains incredibly difficult to determine.
I don’t know what the next few days will bring but it is difficult to see what kind of “good news” event could turn things around. A vaccine sure but science and research takes time. Meanwhile, based on the number of countries infected and global deaths, it is more likely than not the news will continue to be negative for some time, especially as more and more testing occurs. Let’s continue to hope for the best.
Enjoy the article? If you haven’t already, subscribe for free below and never miss a post. No spam. Cancel whenever!