
The Buffet Indicator, Household Debt, Debt/GDP, Household Equity, Household Debt-to-Equity
Broad Market, Economic, and Household Trends
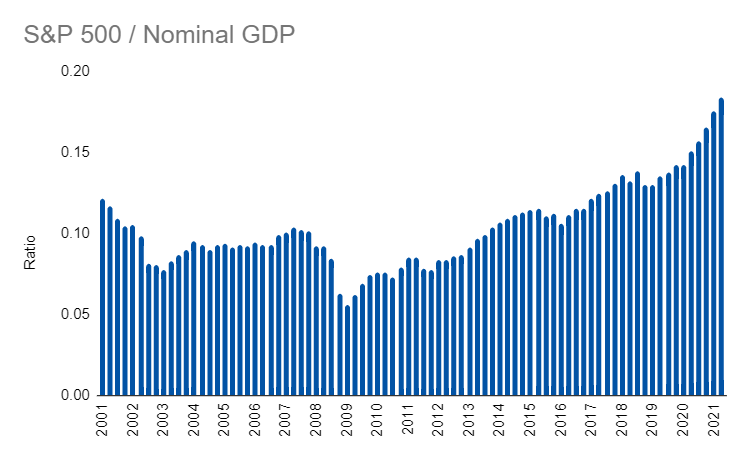
Stocks relative to GDP (popularly known as the Buffet indicator) are at shocking levels:
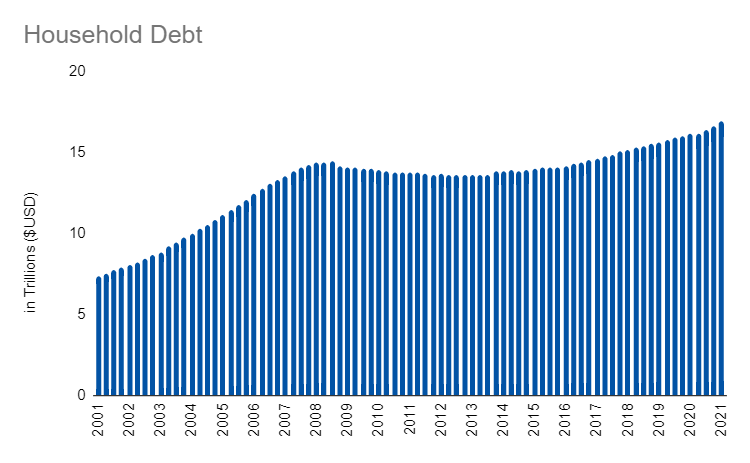
And, it might seem that households are also in a precarious financial position, with more debt than ever:
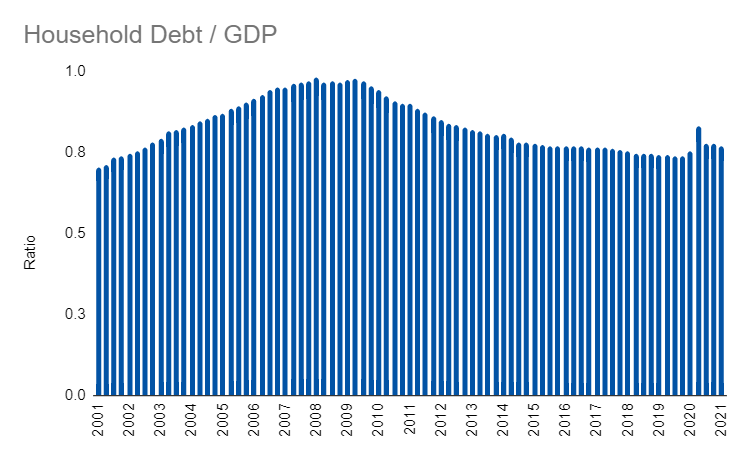
But, household debt relative to GDP has been generally falling since the Great Financial Crisis:
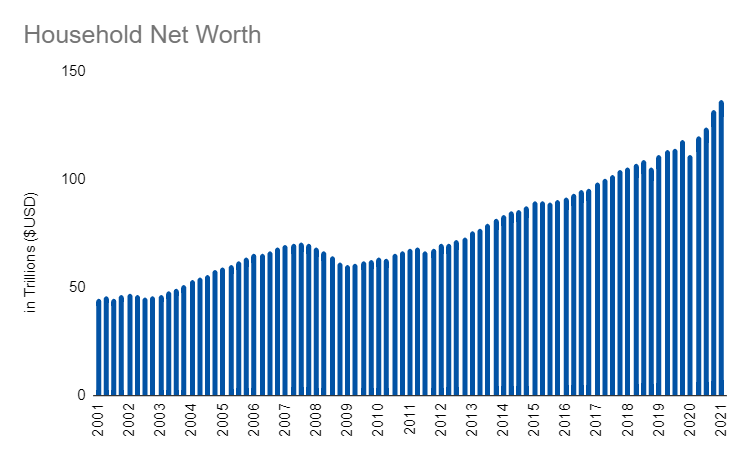
Meanwhile, thanks in part to the stock market, household net worth is up a ton:
And, relative to debt, that means that the household debt-to-equity ratio is doing well:
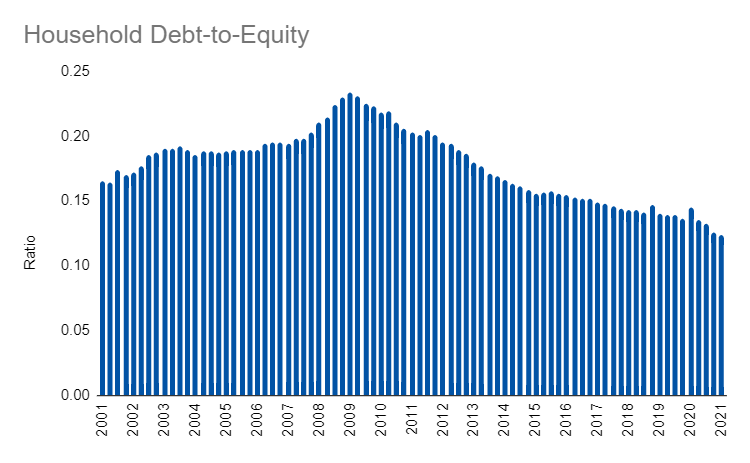
All of these metrics link back to the stock market though. So, if the stock market were to take a major hit, so too would these financial health indicators for households. Fortunately, they are at good levels as opposed to during the 2008 recession, when the market took the worst hit since the Great Depression. So, while some indicators may cause concern, it’s important to remember that we’ve survived tough times before!
Links
Yesterday’s Post | Most Popular Posts | All Historical Posts | Main Site | Contact
If you aren’t already reading this in your inbox, enter your email below to automatically receive Endless Metrics each day. No spam. Cancel any time.