


One of the most popular indicators is known as the Buffett Indicator, due to Warren Buffett’s supposed affinity for the metric.
It’s really simple to calculate. You just take a market index, like the S&P 500, and divide it by Nominal GDP. Here is what that looks like on an annualized basis for the last 100 years:
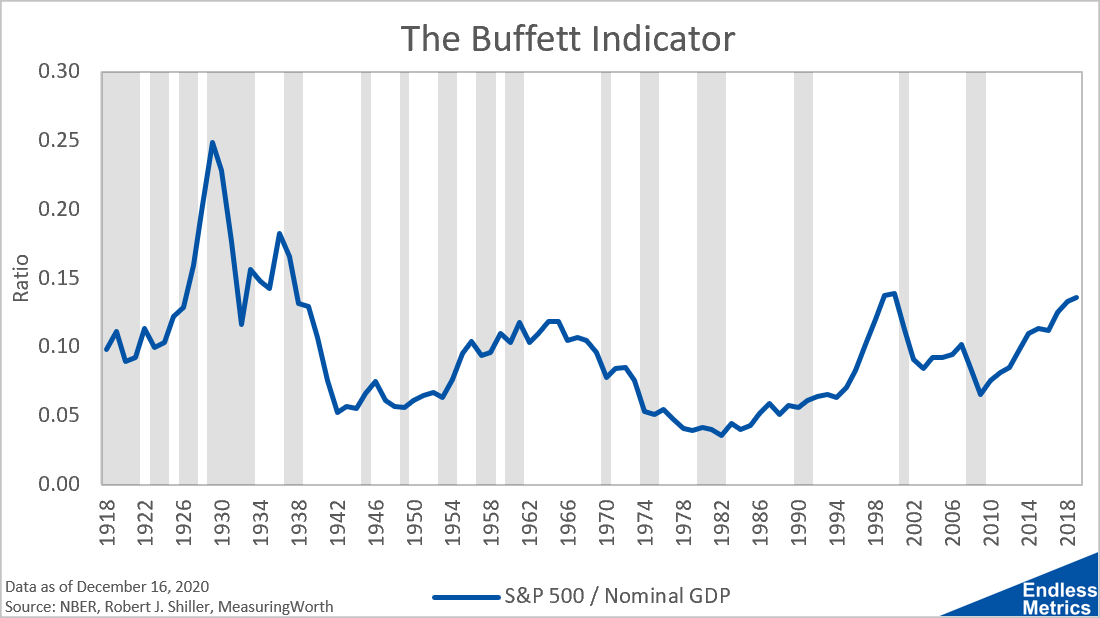
As you can see, we are at the top of the range, with the exception of the 1929 bubble. This would suggest an overvalued stock market, as the price of the market is high relative to the economy.
Now, a lot of people use this as a reason to claim we are in a stock market bubble and the world is going to come to an end. The number one problem I have with that reasoning is that I have never once seen a chart like this that goes back far enough into history.
In fact, most times you see this chart people have it go back to 1990 or maybe 1970. If you only do that, then of course the current market levels will be near the top of the range. To fix this sampling issue, I pulled the longest history I could find right now to see what that looks like:
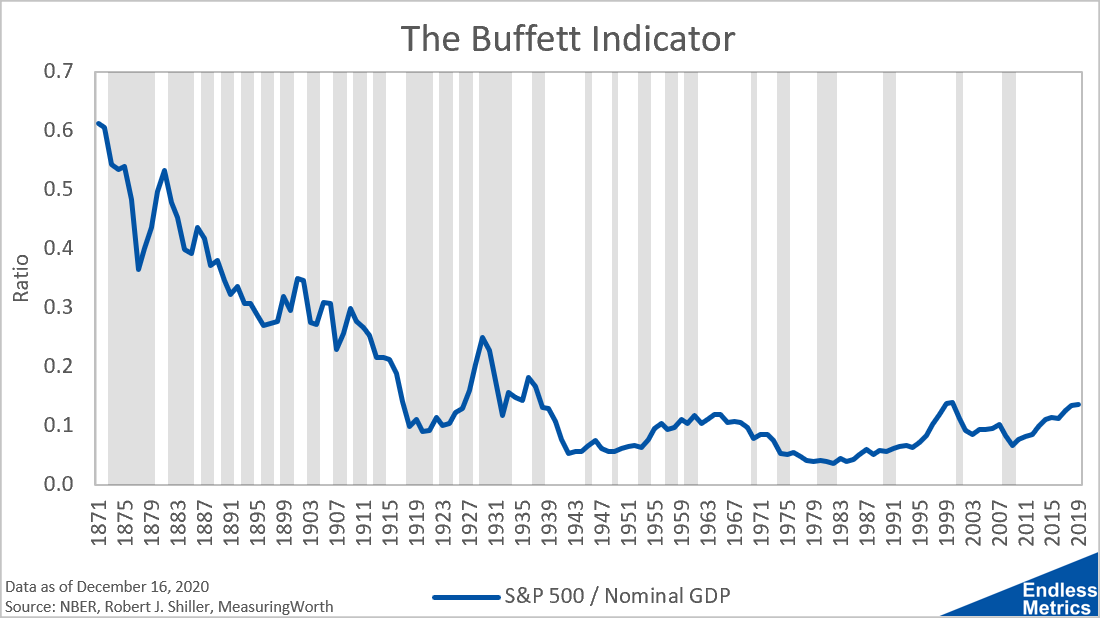
WOW. Okay, so yes the 1929 bubble was a peak and, yeah, we are at a high point for the last one hundred years. But, have you seen the late 1800s!? That trend puts the peaks of the last one hundred years to shame.
While it’s easy to write off history that far back as a long time ago and not relevant to life today, it does highlight an issue with how people analyze certain trends. It’s very easy to take a small snapshot and freak people out. When you get a bigger picture, sometimes you see a different story.