
The Economic Policy Uncertainty Index
Another unprecedented metric
Here’s a cool metric:
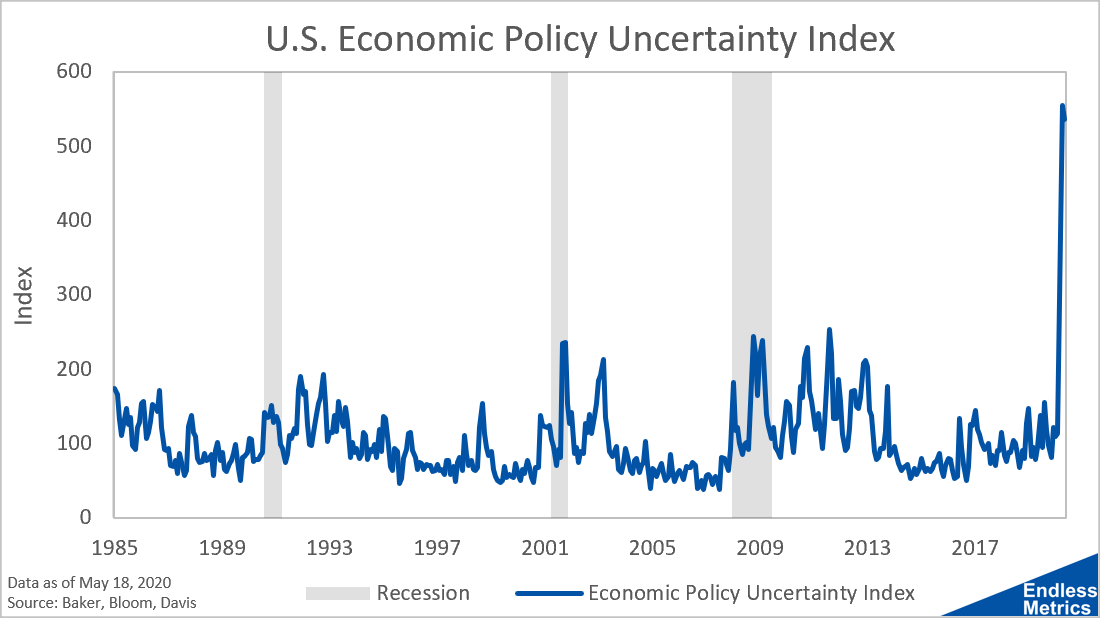
This index is created by combining text from newspapers, expiring tax code provisions, and economic forecasting dispersion to assess market uncertainty. The result is a metric that, just like everything else these days, is in unprecedented territory.
What I find interesting about this chart is that it quantifies a general feeling I’ve had lately (I’m sure along with many people). It is quite simply the sense of not knowing what the heck is going to happen next.
I see terrible numbers for the economy but some practitioners saying it’s temporary and not that bad. I see a surging stock market but veteran investors saying it’s overdone. I see crowded streets in New York City while experts say things still aren’t safe. Every where I look there seems to be contradictory things happening and that creates a ton of uncertainty. At least it’s not just me, the metric agrees too!