The biggest component of GDP is services. And, services have become an increasingly large share of the overall US economy.
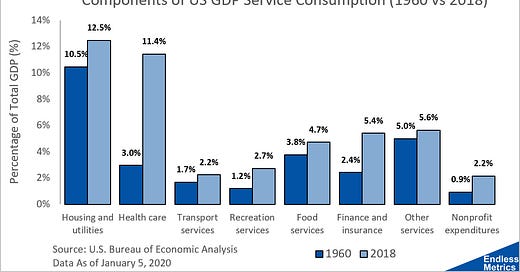
Now, in the same way that we did a breakdown of consumption of goods, we can break down services:

As can obviously be seen, of the eight service sectors, health care stands out far more than anything else. From 1960 to 2018 health care went from 3.0% of the overall economy to 11.4%. That’s almost a fourfold increase! It is barely second to housing and utilities. There is a reason why health care receives a huge amount of attention and is a major political item. Remember just how huge a number $19 trillion in total economic activity is. The number is almost unfathomable - 11.4% of that massive total is just health care. Wow.
It’s also fascinating to see that, unlike goods, every single component has moved in one direction - up! The increase of services as a driver of the economy also means that other aspects of the economy have shrunk in relative importance.
Take manufacturing for instance. A lot of things are still made in the United States but, in terms of economic activity, we are doing a lot more in terms of services. More people are doing more service-based activity as opposed to making something tangible like a car or a toaster.
While reality is much more complicated than a simple chart with a few numbers, what we see is one picture that helps us better understand some factors that drive the broader stories around us. One metric isn’t the final answer. The story of health care and manufacturing cannot be distilled into a few numbers or fancy graphics but they do help craft a narrative. And new information can be analyzed to support the story or evolve it in a new way.
For now, we will leave services with the simple takeaway that they have been an increasingly important economic driver. Furthermore, each underlying service component has been increasingly important. Consumers run the show but there is more to the GDP story so stay tuned.


