
The Yield Curve, Inflation Expectations, and S&P 500
New daily metrics
I’m continuing to build out infrastructure to have a huge inventory of automatically updating charts. Although I am partial to my traditional Endless Metrics chart style, I will be able to produce a lot more narrative content and analysis if I don’t spend so much time manually making visualizations! To that end, here are three awesome time series that you can now check out at any time in the link section below:
Ten-Year Treasury Less Two-Year Treasury
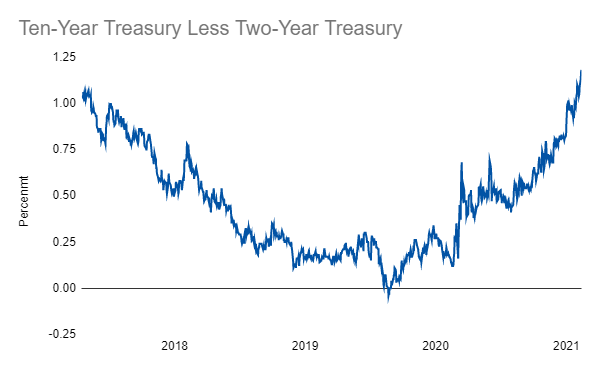
Ten-Year Breakeven Inflation Rate

Have a time series or metric you are particularly interested in? Let me know what it is and I’ll see if I can set up a live chart for it!
Links
Yesterday’s Post | Most Popular Posts | All Historical Posts | Contact
Portfolios
Main Portfolio | Wild Stuff | Shiny Stuff | Safe Stuff | Big Stuff | Random Stuff
Live Charts
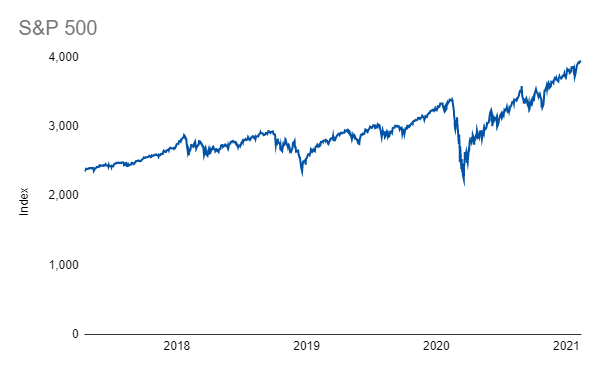
Tracking Portfolio Performance | “Wild Stuff” Constituents | “Shiny Stuff” Constituents | “Safe Stuff” Constituents | Ten-Year Treasury Less Two-Year Treasury | Ten-Year Breakeven Inflation Rate | S&P 500