Continuing yesterday’s thoughts on moving averages, I wanted to investigate a comment I read recently. It went along the lines of “the S&P 500 is currently running about 5% over its 200 day moving average, indicating potential overvaluation.”
Could the relationship between an index and its moving average really indicate overvaluation or undervaluation? It is often said that markets are mean reverting, so it kind of makes some intuitive sense that if the market were above (below) their average there would be some pressure to fall (rise). But it would seem shocking that something as complicated as the market could be predicted by a simple moving average.
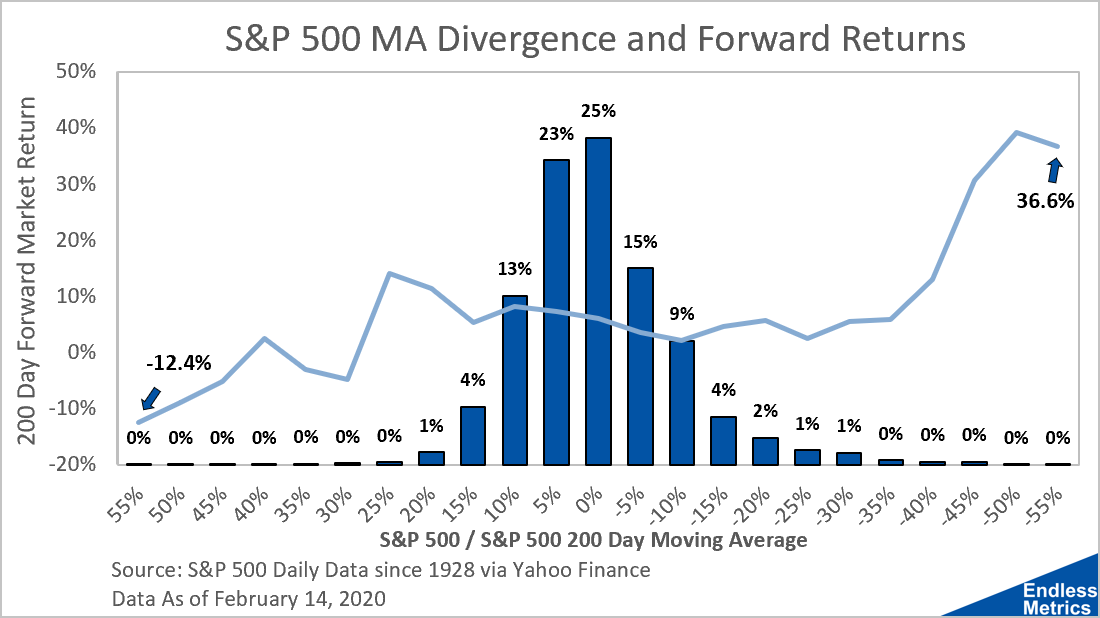
To assess the potential of a moving average as a valuation indicator, I took almost a hundred years of S&P 500 stock returns and compared future returns against index divergence from the moving average. The result is this complicated chart:

Okay, so what the heck is going on here? The bar chart represents how often the S&P 500 is a certain distance away from the 200 day moving average. For example, the index is 0% to 5% higher than the moving average 25% of the time and 5% to 10% higher 23% of the time. The line represents the index change over the next 200 days. In short, this chart shows the average future returns on the index given its distance from the moving average.
We kind of see the relationship we were expecting. The line for index returns is upward sloping from start to finish, meaning that if the S&P 500 is stretched beyond the average, future returns will be lower than they would be otherwise. So, maybe it has potential as a valuation indicator.
Unfortunately, something weird happens when the index is just a little bit above average. Returns go up! In fact, when the S&P 500 is 5% to 25% above its moving average, it’s indicative of even better returns over the next 200 days. That isn’t really valuation then, its more of a momentum indicator. It essentially means that when stocks are going up, you can expect them to keep going up. But if they go up too much (beyond 25%), future returns plummet.
So, the comment I mentioned earlier wasn’t really correct. 5% above average isn’t for overvaluation. It’s for momentum and on average a positive sign for future returns. (I also did this analysis with 50 and 100 day future returns and had very similar results.)
The caveat here is that almost 99% of all market observations fall between 25% to -35%. So, the chances that this indicator would ever stretch far enough into a territory that it could be considered a sign for valuation are slim. At that point, we also run into the issue of small sample sizes. Less observations means less certainty that the indicator would work as intended.
It turns out then, we actually have two indicators in one! The majority of the time, we have an indicator for momentum. Think of that like the old phrase that an object in motion tends to stay in motion. If the stock market is running above its average trend, it will probably keep going. But in the extremes where it’s very far above or below, that's a valuation sign and a good opportunity to buy or sell.
This analysis isn’t something to worry about unless you are trying to trade or time the market - which a lot of people recommend avoiding. You don’t have to care about all this if you just invest at regular intervals and ride the market through the ups and downs.
Otherwise, with history as our guide, we have a few more tools for the toolkit. Remember though, the future is impossible to predict. What alleviates this problem? More metrics! The search continues.


