What if the Great Depression Started Tomorrow?
Spoiler: The S&P 500 would go down...a lot
There have been twenty three market corrections since 1929:
Obviously, the worst of these corrections was during the Great Depression. And, it ultimately took the S&P 500 about twenty five years to get back to the peak it reached at the end of the roaring ‘20s.
It’s easy to ignore really bad events (especially if they happened a long time ago) and pretend they could never happen again. But, at the same time, the future is uncertain and a wide range of scenarios are well within the realm of possibility.
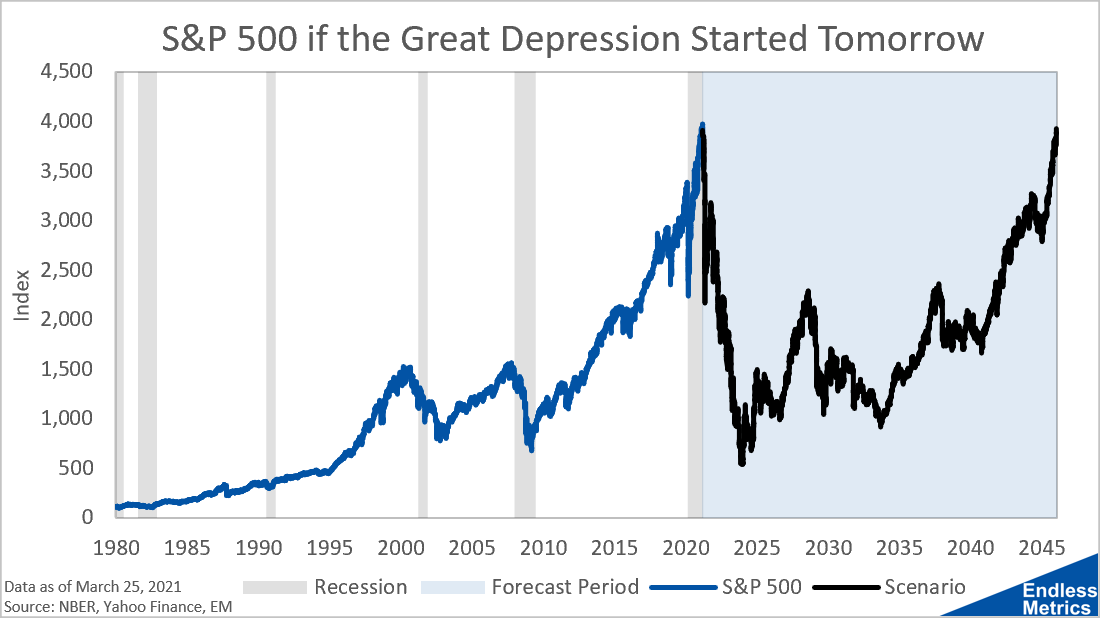
While one certainty about the future is that it will never be exactly like the past, the application of historical scenarios to present conditions can serve as a useful tool for what-if analysis. If potential downside risk is a concern, what better historical scenario to consider than the Great Depression? Here’s how the S&P 500 would look if that infamous market crash happened again based on where the index is today:
If you thought the COVID crash was bad then you certainly wouldn’t like this! What’s wild about the Great Depression is that it kicked off with Black Tuesday, where the market crashed in a spectacular fashion that, on the chart, looks very similar to the COVID drop last year. And that was just the start! It got so much worse.
If this scenario were to happen based on the March 25, 2021 close of 3,909.52, we wouldn’t see bottom for about two and a half years. At the bottom, the S&P would hit 539.92, which is a level the index hasn’t seen since June 16, 1995. And, for everyone who is now used to super fast recoveries after this past year, prepare for the long haul, as the S&P 500 wouldn’t surpass 3,909.52 again until 2046.
It may seem impossible, it may seem crazy but this is exactly what people lived through ninety years ago. Suddenly, those stories about people storing money under the mattress don’t seem so paranoid and silly, do they?
Enjoying the content?
If you want to help support my crazy dream to one day write about the markets full time and produce even more endless metrics, maybe you could sign up for ongoing content (if you haven’t already) or sign up a friend. Don’t worry - you can cancel whenever you decide you’re bored or need an inbox cleanse. I don’t take it personally!
Links
Yesterday’s Post | Most Popular Posts | All Historical Posts | Contact
Tracking Portfolios
Overall Comparison | Wild Stuff - Chart | Shiny Stuff - Chart | Safe Stuff - Chart | Big Stuff - Chart | Random Stuff - Chart
Live Charts
Ten-Year Treasury Less Two-Year Treasury | Ten-Year Breakeven Inflation Rate | S&P 500 | S&P Rolling All-Time High | S&P 500 Drawdown | S&P 500 Rogue Wave Indicator | S&P 500 Moving Averages | S&P 500 / 200-Day Moving Average | S&P 500 / 50-Day Moving Average | S&P 500 50-Day Moving Average / 200-Day Moving Average | S&P 500 Relative Strength Index | CBOE Volatility Index (VIX) | Three-Month USD LIBOR | Three-Month Treasury Bill (Secondary Rate) | TED Spread | Price of Bitcoin | Bitcoin Rolling All-Time High | Bitcoin Drawdown | Bitcoin Rogue Wave Indicator | Nasdaq Composite Index | Nasdaq Composite All-Time High | Nasdaq Composite Drawdown | Nasdaq Composite Wave Indicator | Nasdaq Composite Moving Averages | Nasdaq Composite / 200-Day Moving Average | Nasdaq Composite / 50-Day Moving Average | Nasdaq Composite 50-Day Moving Average / 200-Day Moving Average | Nasdaq Composite Relative Strength Index


Hi Luke, could you please rerun the chart and analysis for 2025?