You know an economic topic has hit the big time when normal people are willing to actually discuss something related to economics without falling asleep. These days, inequality is one of those topics.
There are a lot of ways inequality is measured, whether by looking at people that make a ton of money, or people that have a ton of wealth, or specifically targeting executives and company founders that have a lot of equity in companies with high market capitalization. While many of these angles have been thoroughly discussed elsewhere, I think it’s also important to note that this phenomenon isn’t just limited to people.
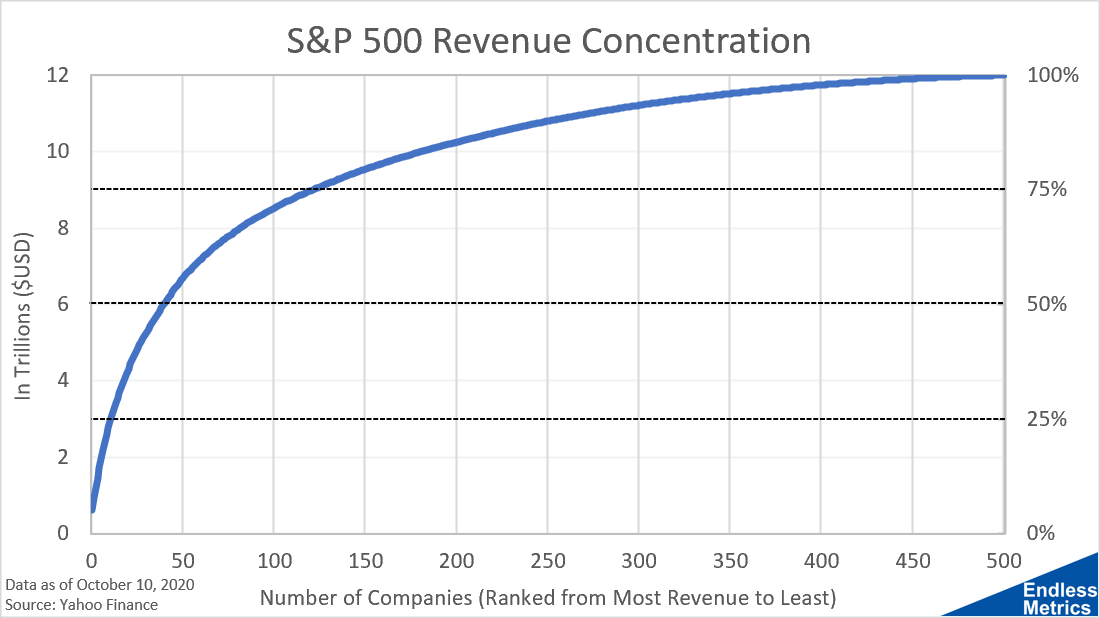
Companies in the S&P 500 (or the stock market in general) also have issues with income inequality. To measure this, let’s rank companies in the S&P 500 by revenue and calculate the cumulative amount:

In the last twelve months, the constituents of the S&P 500 brought home almost 12 trillion in revenue. However, 50% of that revenue came from less than 10% of constituents. And, 75% of revenue (or about 9 trillion dollars) came from about 25% of constituents (or about 125 companies).
So, income inequality isn’t just a people problem. It’s also a company problem. And, as an investor, it’s an important element to assess when analyzing both the idiosyncratic risk of a single investment as well as the systemic risk inherent in the market.
More Metrics
Walmart brings home the most revenue

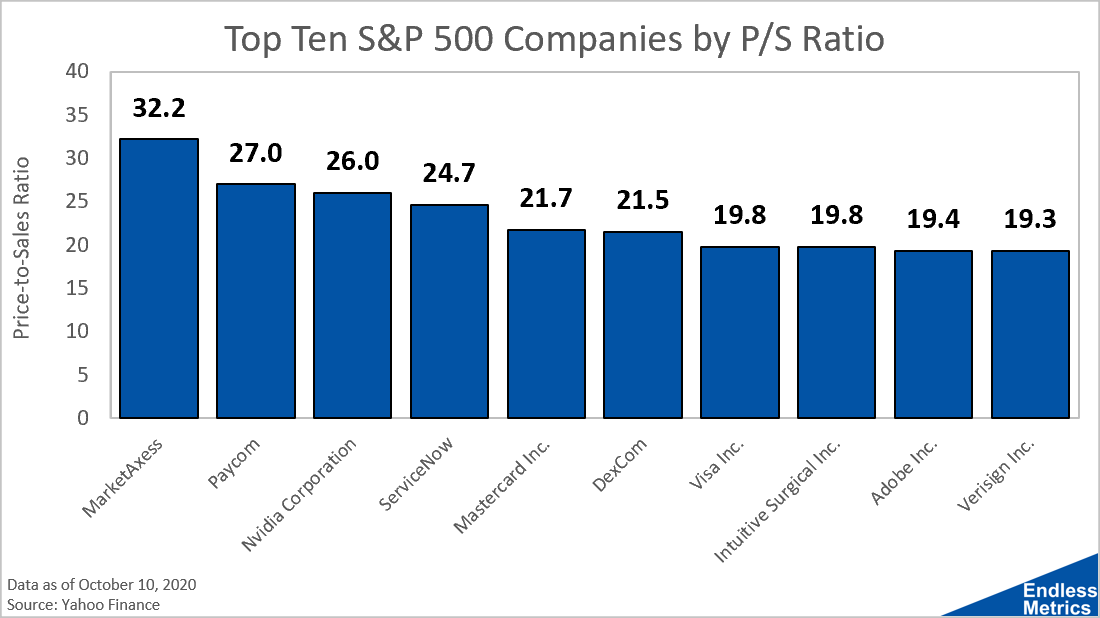
These are the most overvalued S&P 500 companies as analyzed by the price-to-sales ratio

Links
Yesterday’s Post | Most Popular Posts of All Time | All Historical Posts | Contact Me
Enjoying the content?
If you want to help support my crazy dream to one day write about the markets full time and produce even more endless metrics, maybe you could sign up for ongoing content (if you haven’t already) or sign up a friend. Don’t worry - you can cancel whenever you decide you’re bored or need an inbox cleanse. I don’t take it personally!


