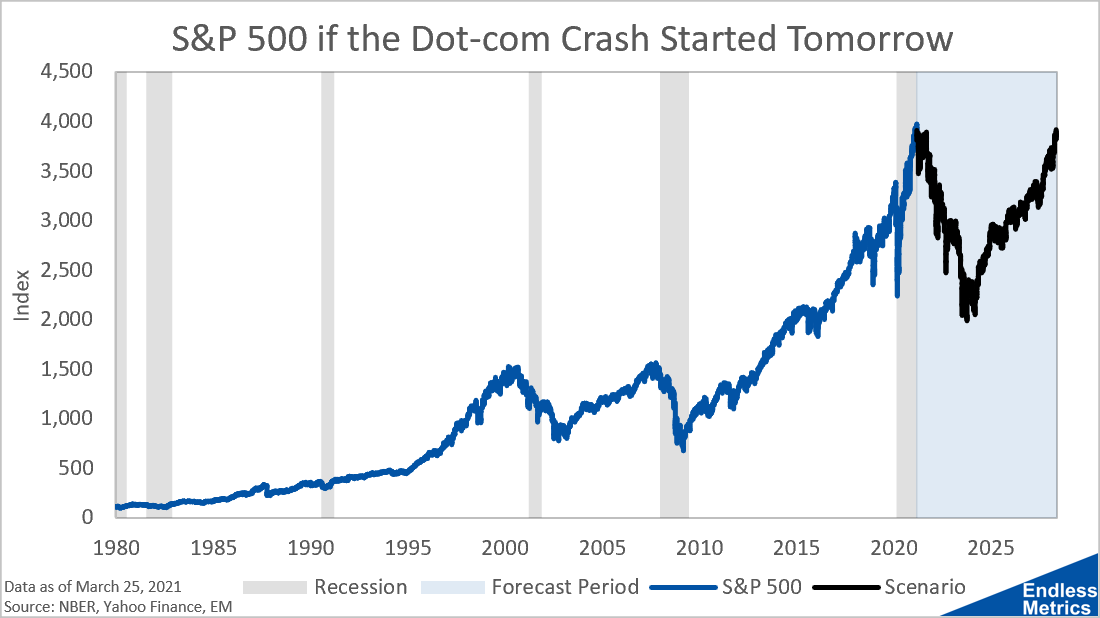
Yesterday, I talked about the concept of scenario analysis for forecasting by applying the Great Depression to the S&P 500 as it stands today. But there are lots of other interesting market crashes to check out as well like the Dot-com crash:
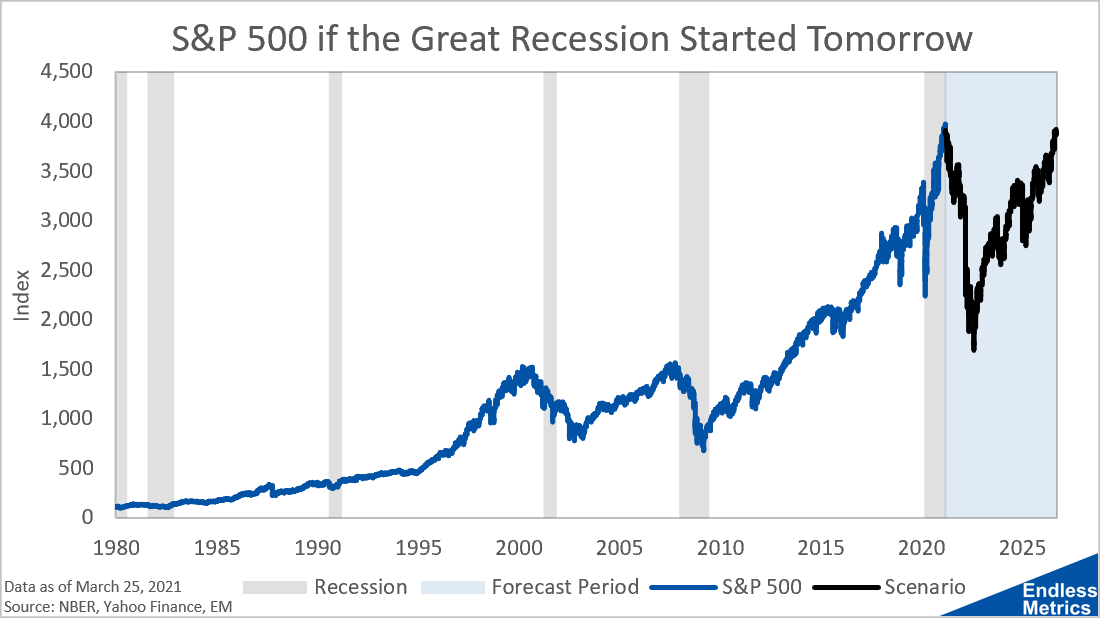
The Great Recession was even worse in terms of depth but had a slightly faster recovery:
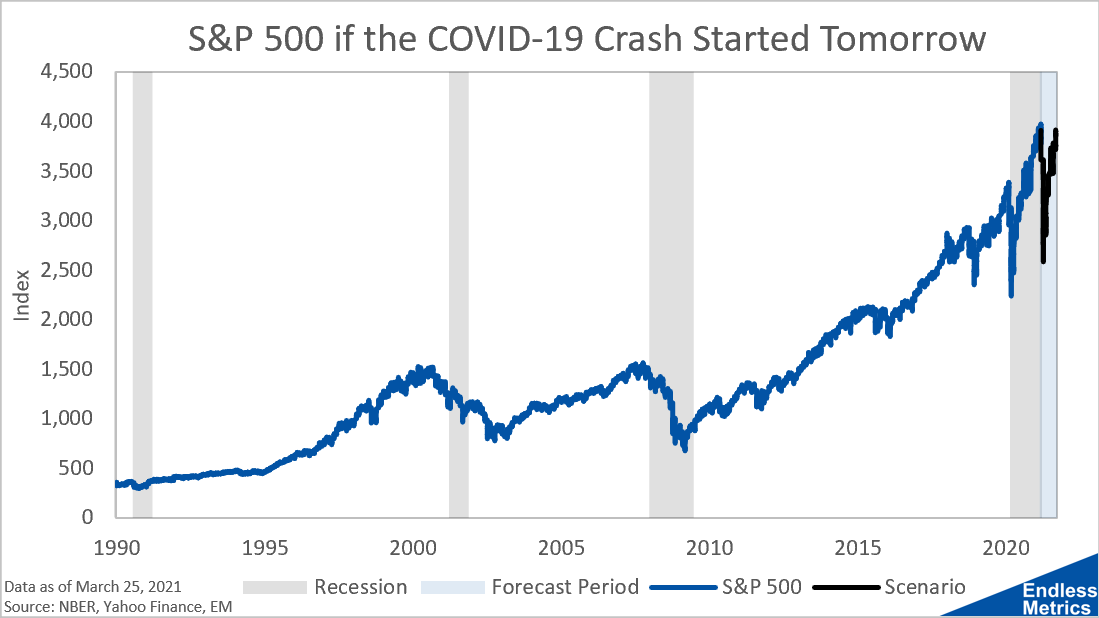
And, if anyone was interested in reliving COVID all over again (any volunteers?), we can see how that looks too:
The surprising thing is just how much shorter the COVID crash was in duration to the other two crashes. In hindsight, it really doesn’t seem so bad in market terms compared to the other two events. But, let’s just hope that the future looks more positive than these three scenarios!
Links
Yesterday’s Post | Most Popular Posts | All Historical Posts | Contact
Tracking Portfolios
Overall Comparison | Wild Stuff - Chart | Shiny Stuff - Chart | Safe Stuff - Chart | Big Stuff - Chart | Random Stuff - Chart
Live Charts
Ten-Year Treasury Less Two-Year Treasury | Ten-Year Breakeven Inflation Rate | S&P 500 | S&P Rolling All-Time High | S&P 500 Drawdown | S&P 500 Rogue Wave Indicator | S&P 500 Moving Averages | S&P 500 / 200-Day Moving Average | S&P 500 / 50-Day Moving Average | S&P 500 50-Day Moving Average / 200-Day Moving Average | S&P 500 Relative Strength Index | CBOE Volatility Index (VIX) | Three-Month USD LIBOR | Three-Month Treasury Bill (Secondary Rate) | TED Spread | Price of Bitcoin | Bitcoin Rolling All-Time High | Bitcoin Drawdown | Bitcoin Rogue Wave Indicator | Nasdaq Composite Index | Nasdaq Composite All-Time High | Nasdaq Composite Drawdown | Nasdaq Composite Wave Indicator | Nasdaq Composite Moving Averages | Nasdaq Composite / 200-Day Moving Average | Nasdaq Composite / 50-Day Moving Average | Nasdaq Composite 50-Day Moving Average / 200-Day Moving Average | Nasdaq Composite Relative Strength Index


