
New Tracking Portfolio Section!
Six new daily charts
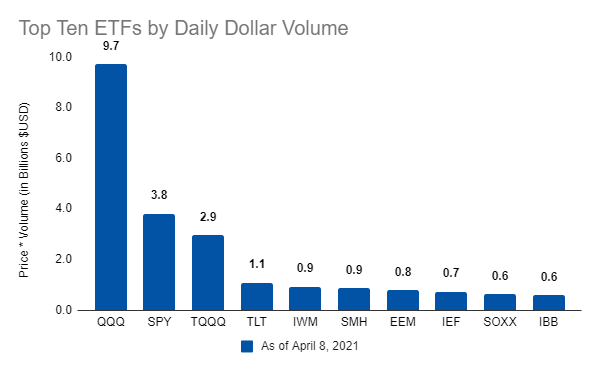
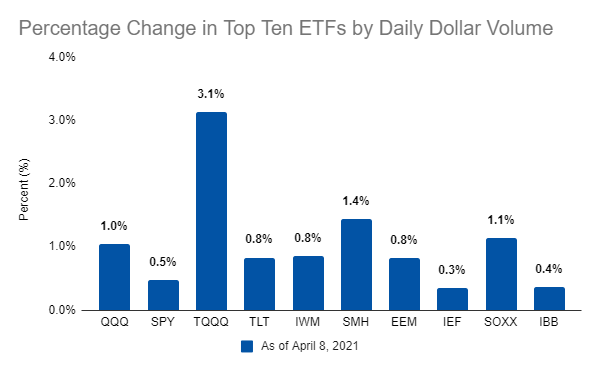
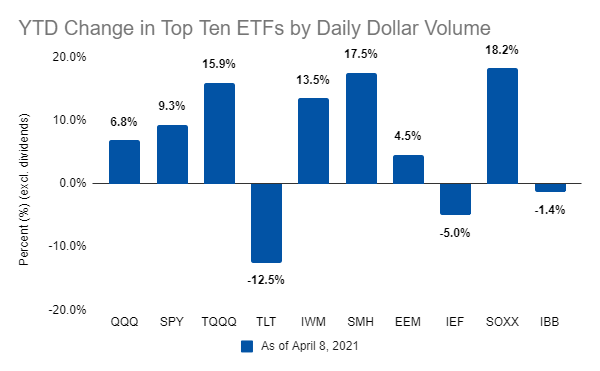
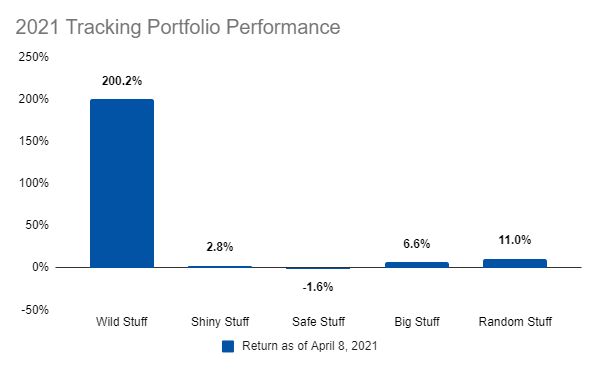
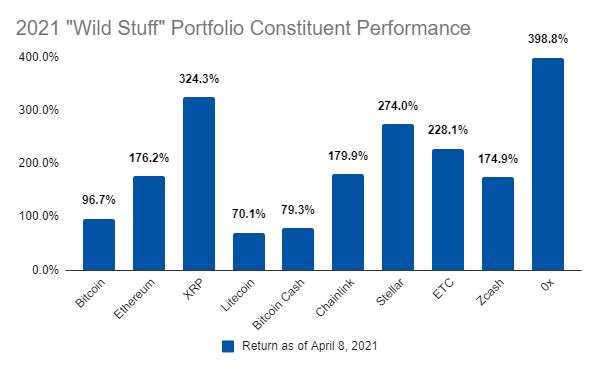
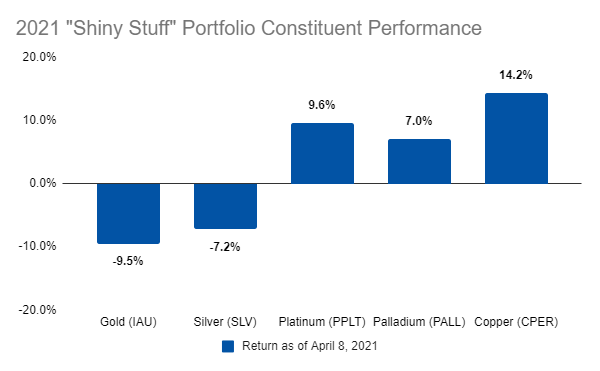
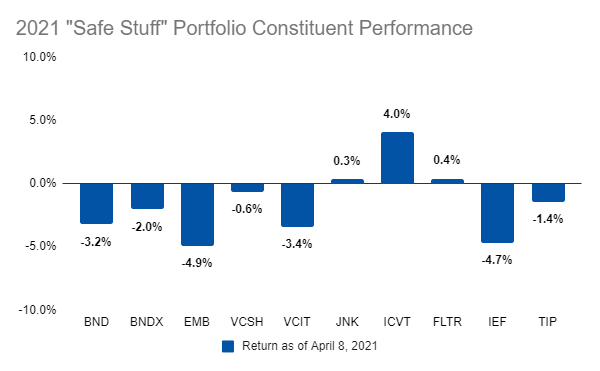
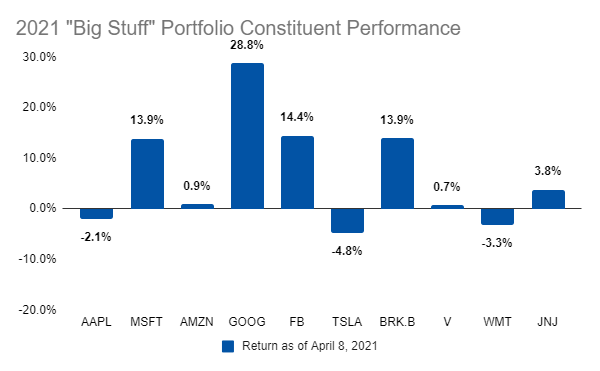
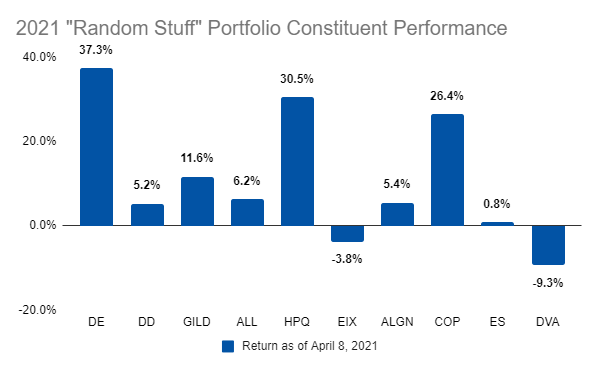
The number of daily charts is ramping up (and this is just the beginning…this is “Endless” Metrics, after all). I replaced the links in the old tracking portfolios section with six charts that will show performance Tuesday through Saturday (like the ETF section). Oh, and I added some numbers to the ETF charts so that they are easier to analyze. Many more charts and new newsletter sections to come soon!
Daily ETF Update
Tracking Portfolios
Links
Yesterday’s Post | Most Popular Posts | All Historical Posts | Contact
Live Charts
Ten-Year Treasury Less Two-Year Treasury | Ten-Year Breakeven Inflation Rate | S&P 500 | S&P Rolling All-Time High | S&P 500 Drawdown | S&P 500 Rogue Wave Indicator | S&P 500 Moving Averages | S&P 500 / 200-Day Moving Average | S&P 500 / 50-Day Moving Average | S&P 500 50-Day Moving Average / 200-Day Moving Average | S&P 500 Relative Strength Index | CBOE Volatility Index (VIX) | Three-Month USD LIBOR | Three-Month Treasury Bill (Secondary Rate) | TED Spread | Price of Bitcoin | Bitcoin Rolling All-Time High | Bitcoin Drawdown | Bitcoin Rogue Wave Indicator | Nasdaq Composite Index | Nasdaq Composite All-Time High | Nasdaq Composite Drawdown | Nasdaq Composite Wave Indicator | Nasdaq Composite Moving Averages | Nasdaq Composite / 200-Day Moving Average | Nasdaq Composite / 50-Day Moving Average | Nasdaq Composite 50-Day Moving Average / 200-Day Moving Average | Nasdaq Composite Relative Strength Index | Moody's Seasoned Aaa Corporate Bond Yield | Moody's Seasoned Baa Corporate Bond Yield | Moody’s Aaa less Baa Corporate Bond Yield | Dow Jones Industrial Average | Dow Jones Transportation Average | Dow Jones Industrial Average / Transportation Average