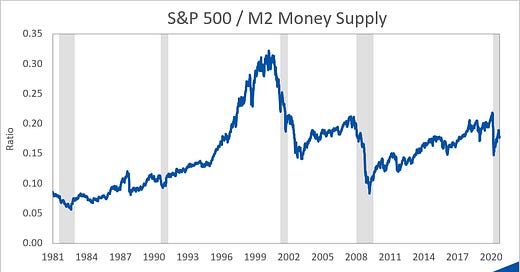
A lot of stimulus money was printed in response to the COVID-19 crisis, which inflated the money supply. In a similar approach as dividing the market by GDP, we can divide the S&P 500 by the M2 Money Supply and analyze that stimulus impact relative to the stock market:

Even though the S&P 500 has hit a new all-time high post-COVID, it remains well below the money-supply adjusted pre-COVID peak. This suggests that stocks have merely inflated relative to the dollar (i.e. there are more dollars printed and thus it takes more dollars to buy shares of stocks which are priced in dollar terms) and the recent rally has further to go before truly recovering.
But, as always, remember this is just one metric and there are plenty of others that will suggest the complete opposite - that the market is overvalued! Unfortunately, there is no perfect valuation metric but it’s important to consider ones like this that can provide an alternative viewpoint.
More Metrics
The coronavirus continues its steady climb worldwide

Links
Yesterday’s Post | Most Popular Posts of All Time | All Historical Posts | Contact Me
Enjoying the content?
If you want to help support my crazy dream to one day write about the markets full time and produce even more endless metrics, maybe you could sign up for ongoing content (if you haven’t already) or sign up a friend. Don’t worry - you can cancel whenever you decide you’re bored or need an inbox cleanse. I don’t take it personally!


