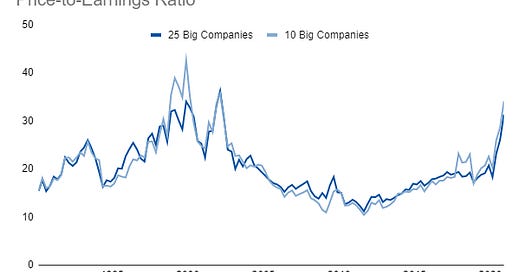
Overall market PE Ratios are high...but how much of that comes from depressed earnings?
A good bit!
While a high PE ratio might give us terrible flashbacks of the dot-com era, we also need to consider how much of the ratio is driven by depressed earnings:
What’s great about the PE ratio is that we can consider where the market would be under alternative scenarios. For one, what would the PE ratio of the market be if earnings weren’t down so much?
If earnings were suddenly back at their trailing-twelve-month peak of $385.6 Billion in 2019Q4, the PE ratio of these 25 companies would go from 31.3 to 25.0, which suddenly doesn’t seem nearly as bad!
It’s obviously still elevated compared to the long-term trend. The aggregate PE ratio of these companies was 20.7 in 2019Q4. So, to go from 25.0 to 20.7 we would need to see a 17.1% decrease in market capitalization. That would be a painful market decline but it wouldn’t be nearly as bad as what we saw during the COVID crash.
This is all speculation but the point here is that we can use these metrics to give ourselves some conceptual anchor points to better understand what the market is doing and where it might go. It could go anywhere! But, at least we can analytically ringfence the more probable paths to a certain extent. And, with more metrics, we will only get more of these anchor points that we can use!
Links
Yesterday’s Post | Most Popular Posts | All Historical Posts | Main Site | Contact


