


The Price-to-Earnings Ratio
The most popular fundamental ratio
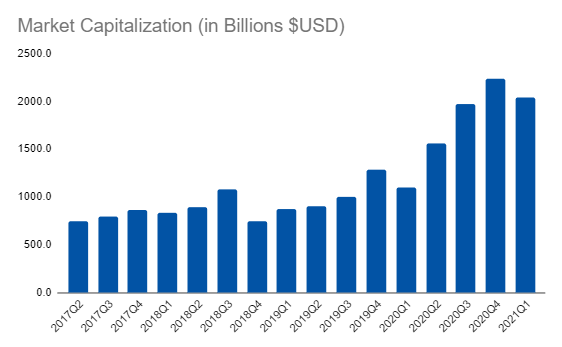
Yesterday, we looked at Apple’s market capitalization:
And, we had previously looked at Apple’s Net Income:
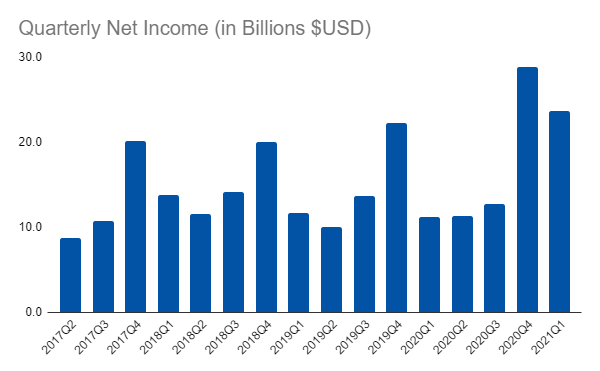
We want to analyze the relationship between market value and earnings but we have another step to do. If you notice, Apple’s net income jumps around depending on the quarter. That’s because, at the end of the year, customers tend to buy a lot more products for the holidays.
To smooth this effect, we want to take a rolling four-quarter sum, which is usually referred to as trailing twelve month (TTM) or last twelve month (LTM):
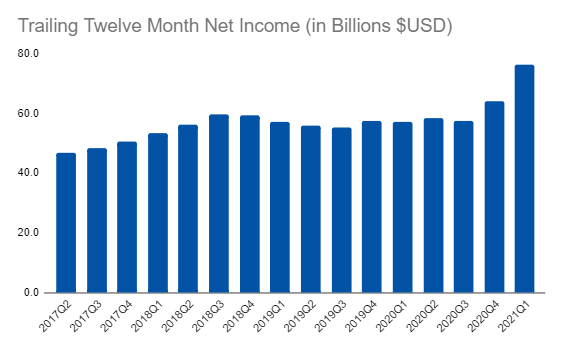
Now net income (aka earnings) looks a lot more consistent and we can take the ratio between market capitalization and earnings:

Now we have a standardized metric we can use to compare any company of any size to any other! This is probably the most popular ratio out there for stocks but there are a ton more that we can analyze. So, don’t worry, this is just the beginning of our stock analysis toolkit buildout!
Links
Yesterday’s Post | Most Popular Posts | All Historical Posts | Main Site | Contact