
U.S. Debt
Trillions of it
Today is Thursday and, as I mentioned yesterday, I want to start bringing some new topics into the mix as part of “Theoretical Thursday.” Today’s post isn’t too theoretical but does cover an important topic I have yet to talk about in the newsletter - U.S. Debt:
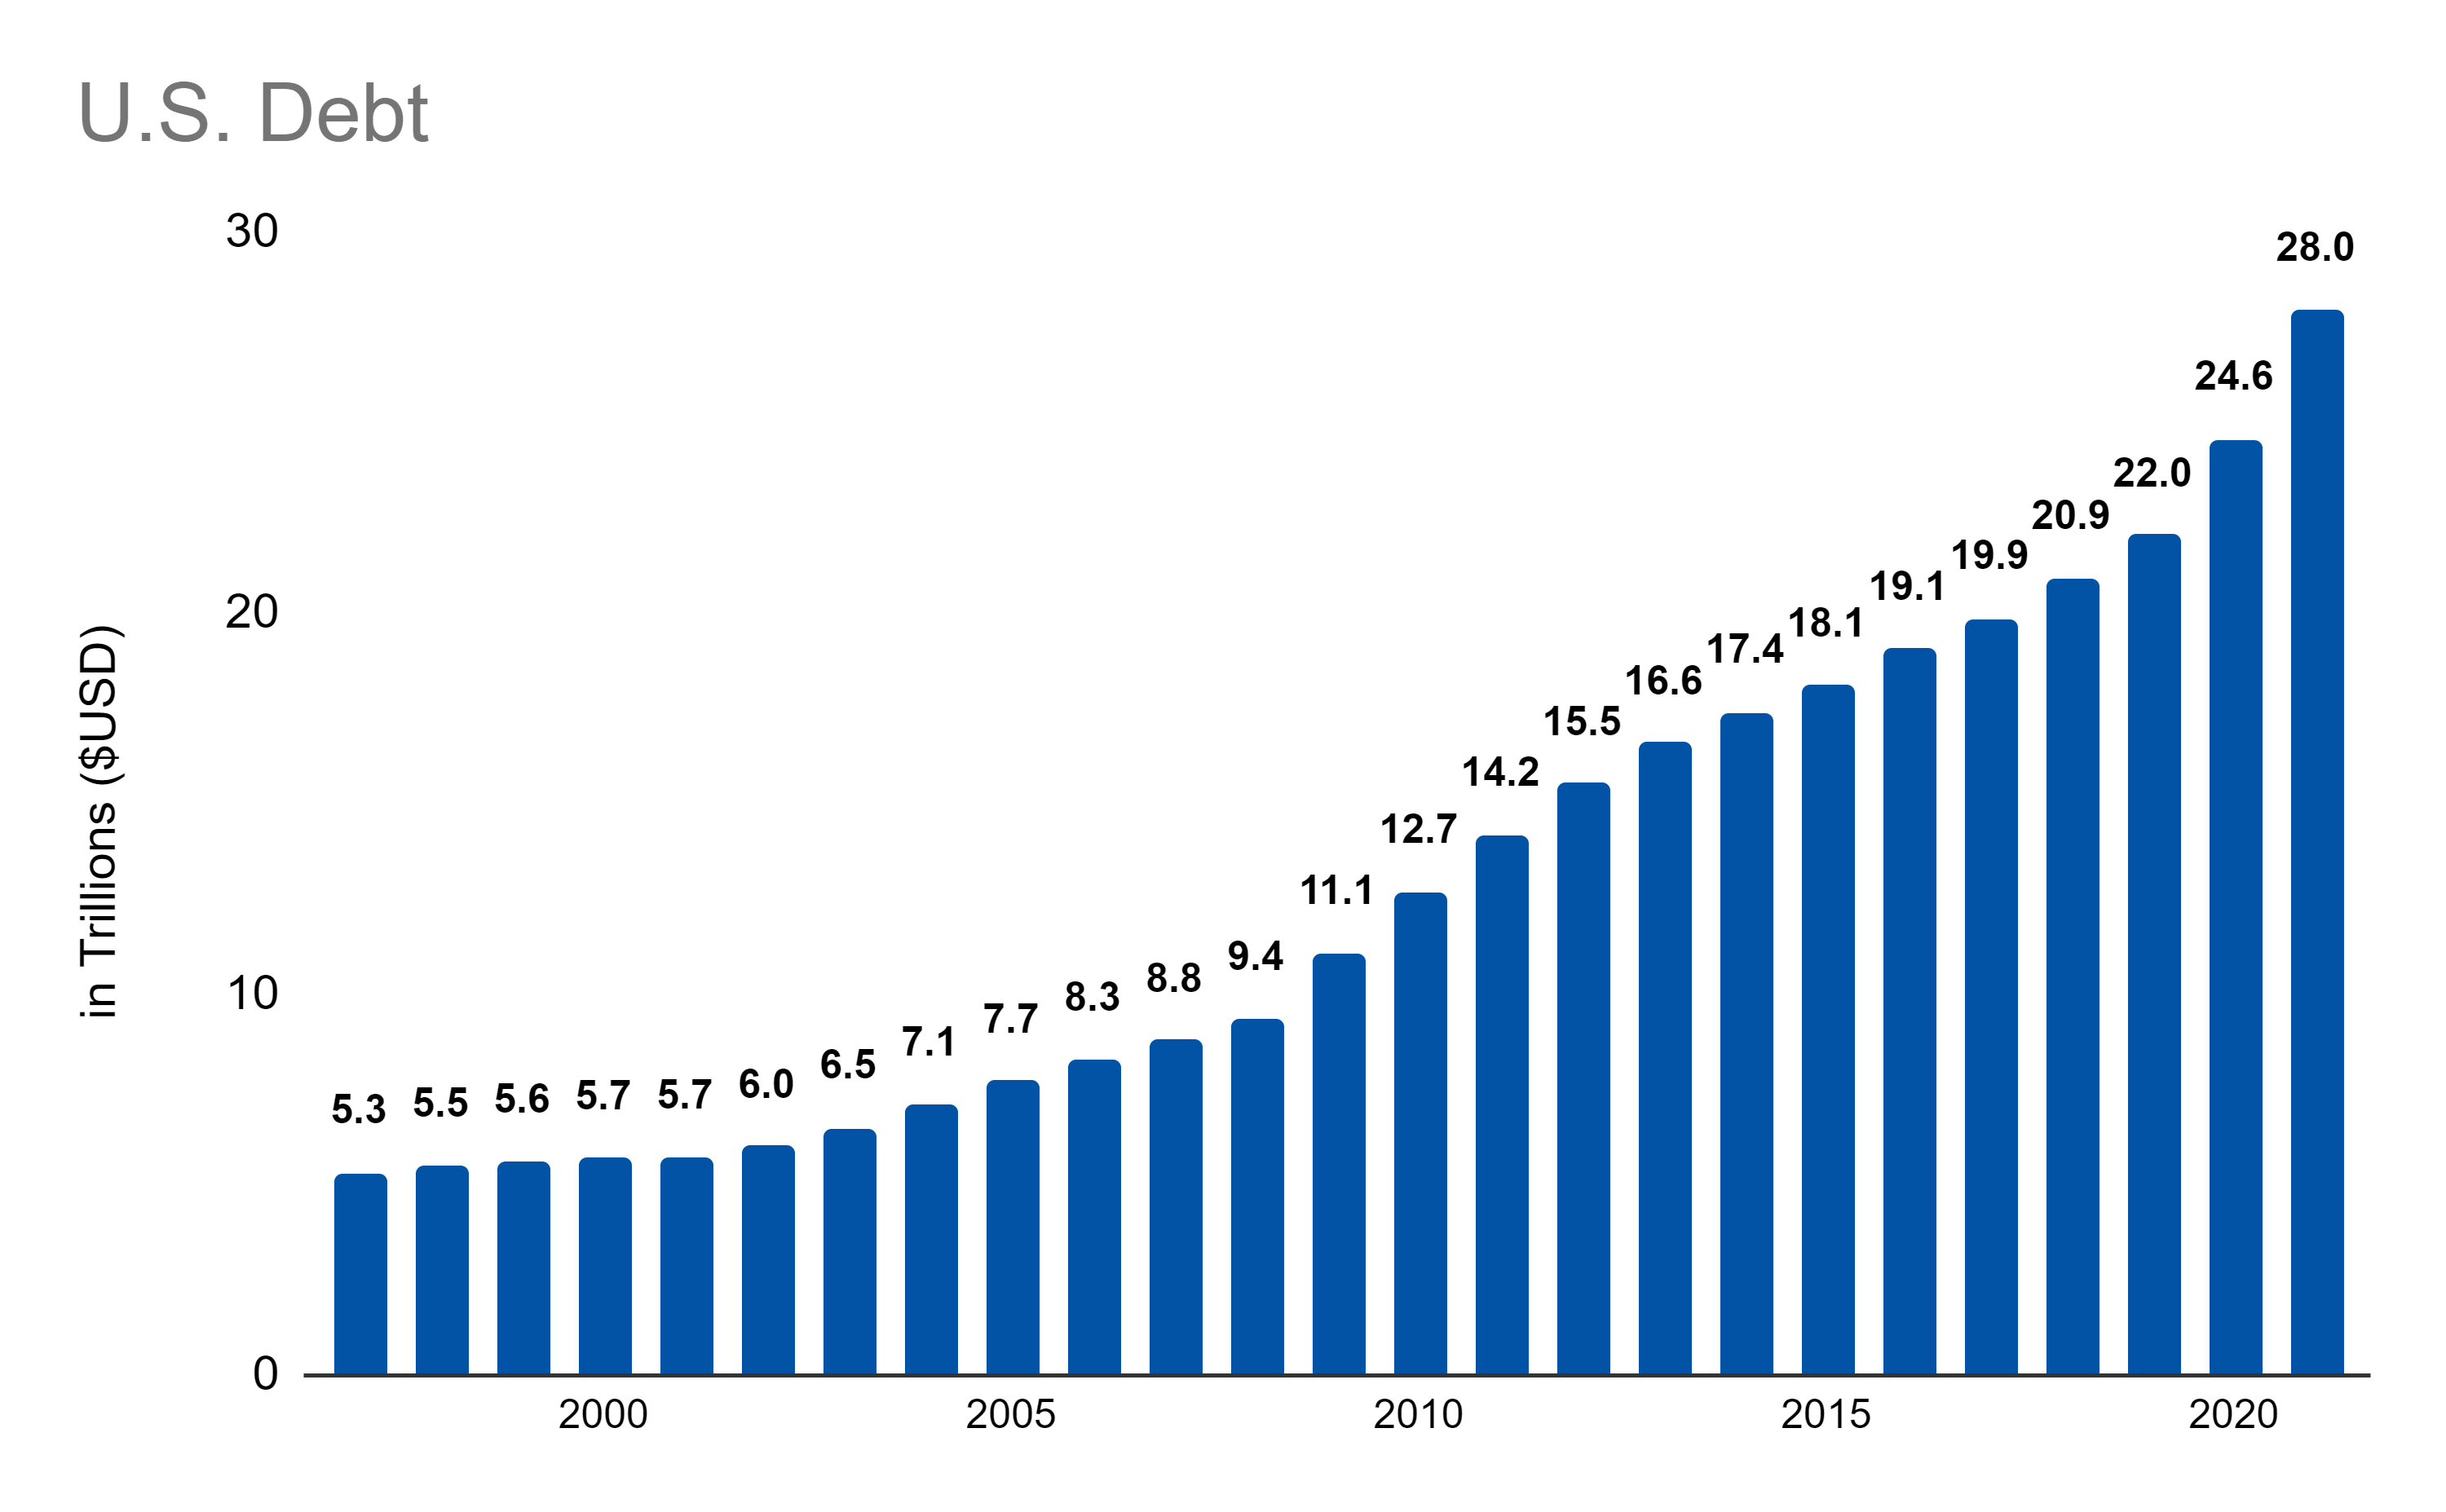
There’s a lot of it. And, that big number is what is often used for shocking headlines about how much debt the U.S. has, typically from the perspective that it is a bad thing.
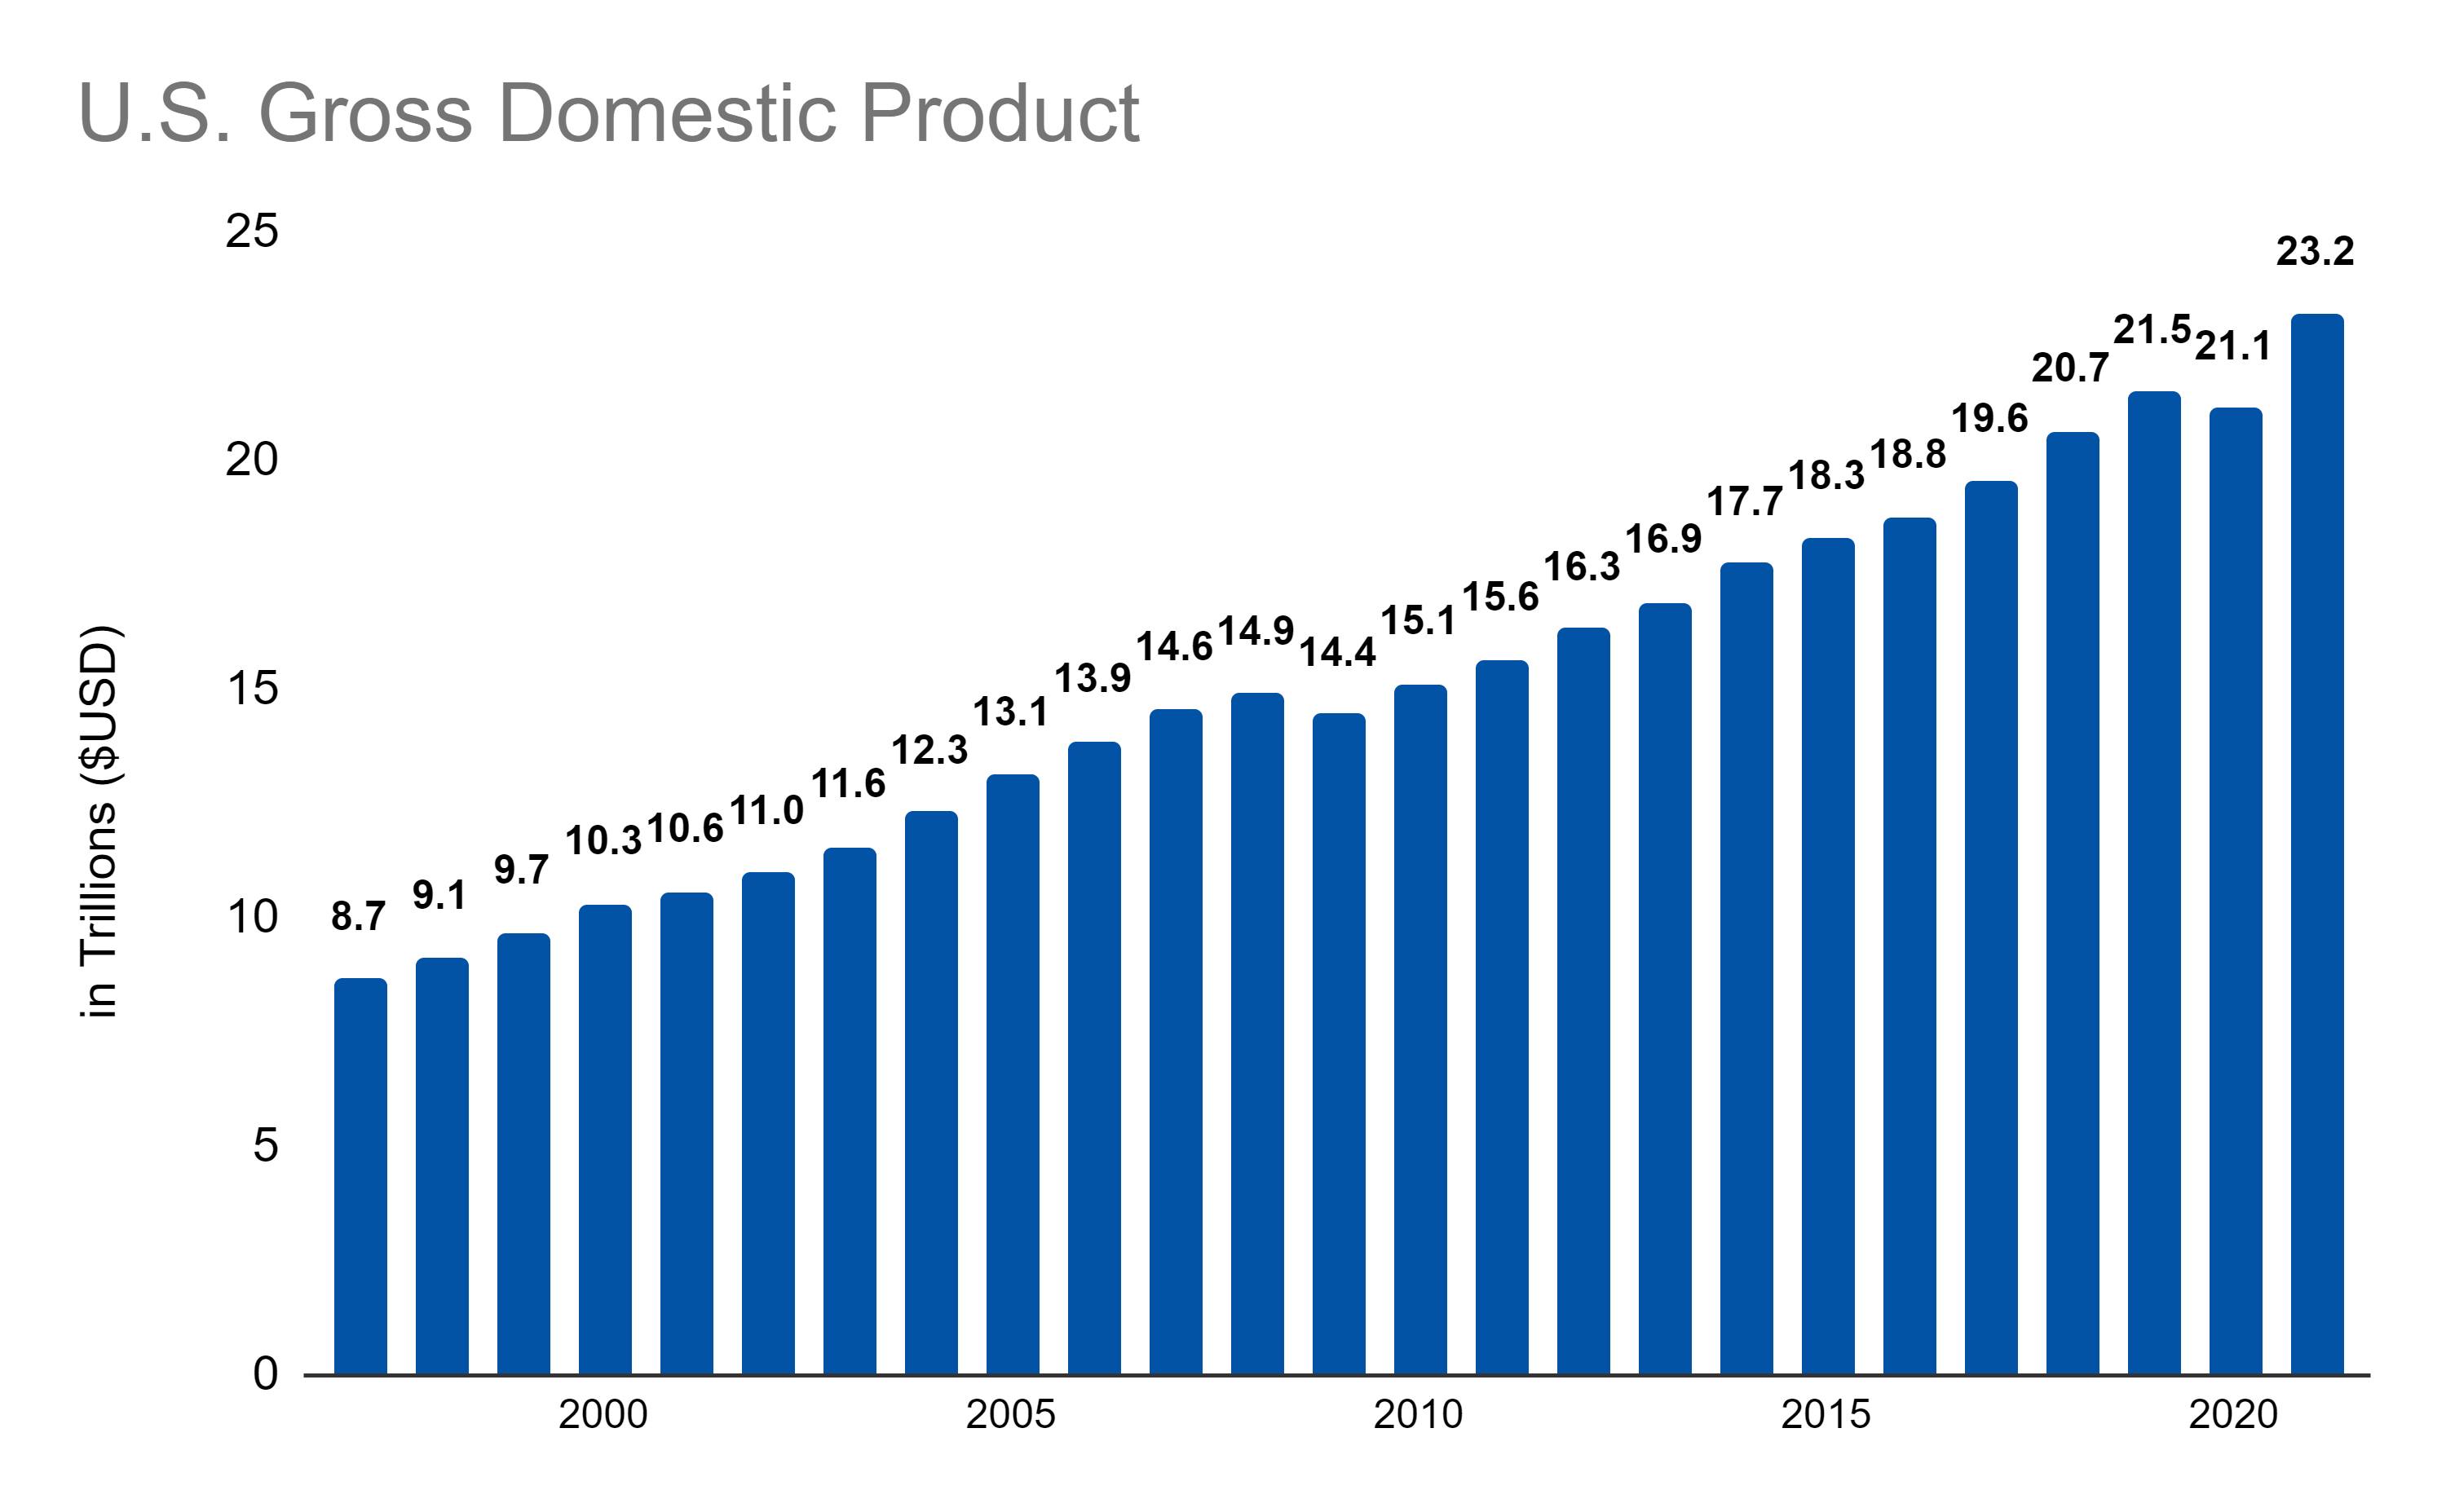
Now, I’m not saying it isn’t bad but we have to consider more than just the nominal amount of debt. Consider, for example, how much gross domestic product has grown:
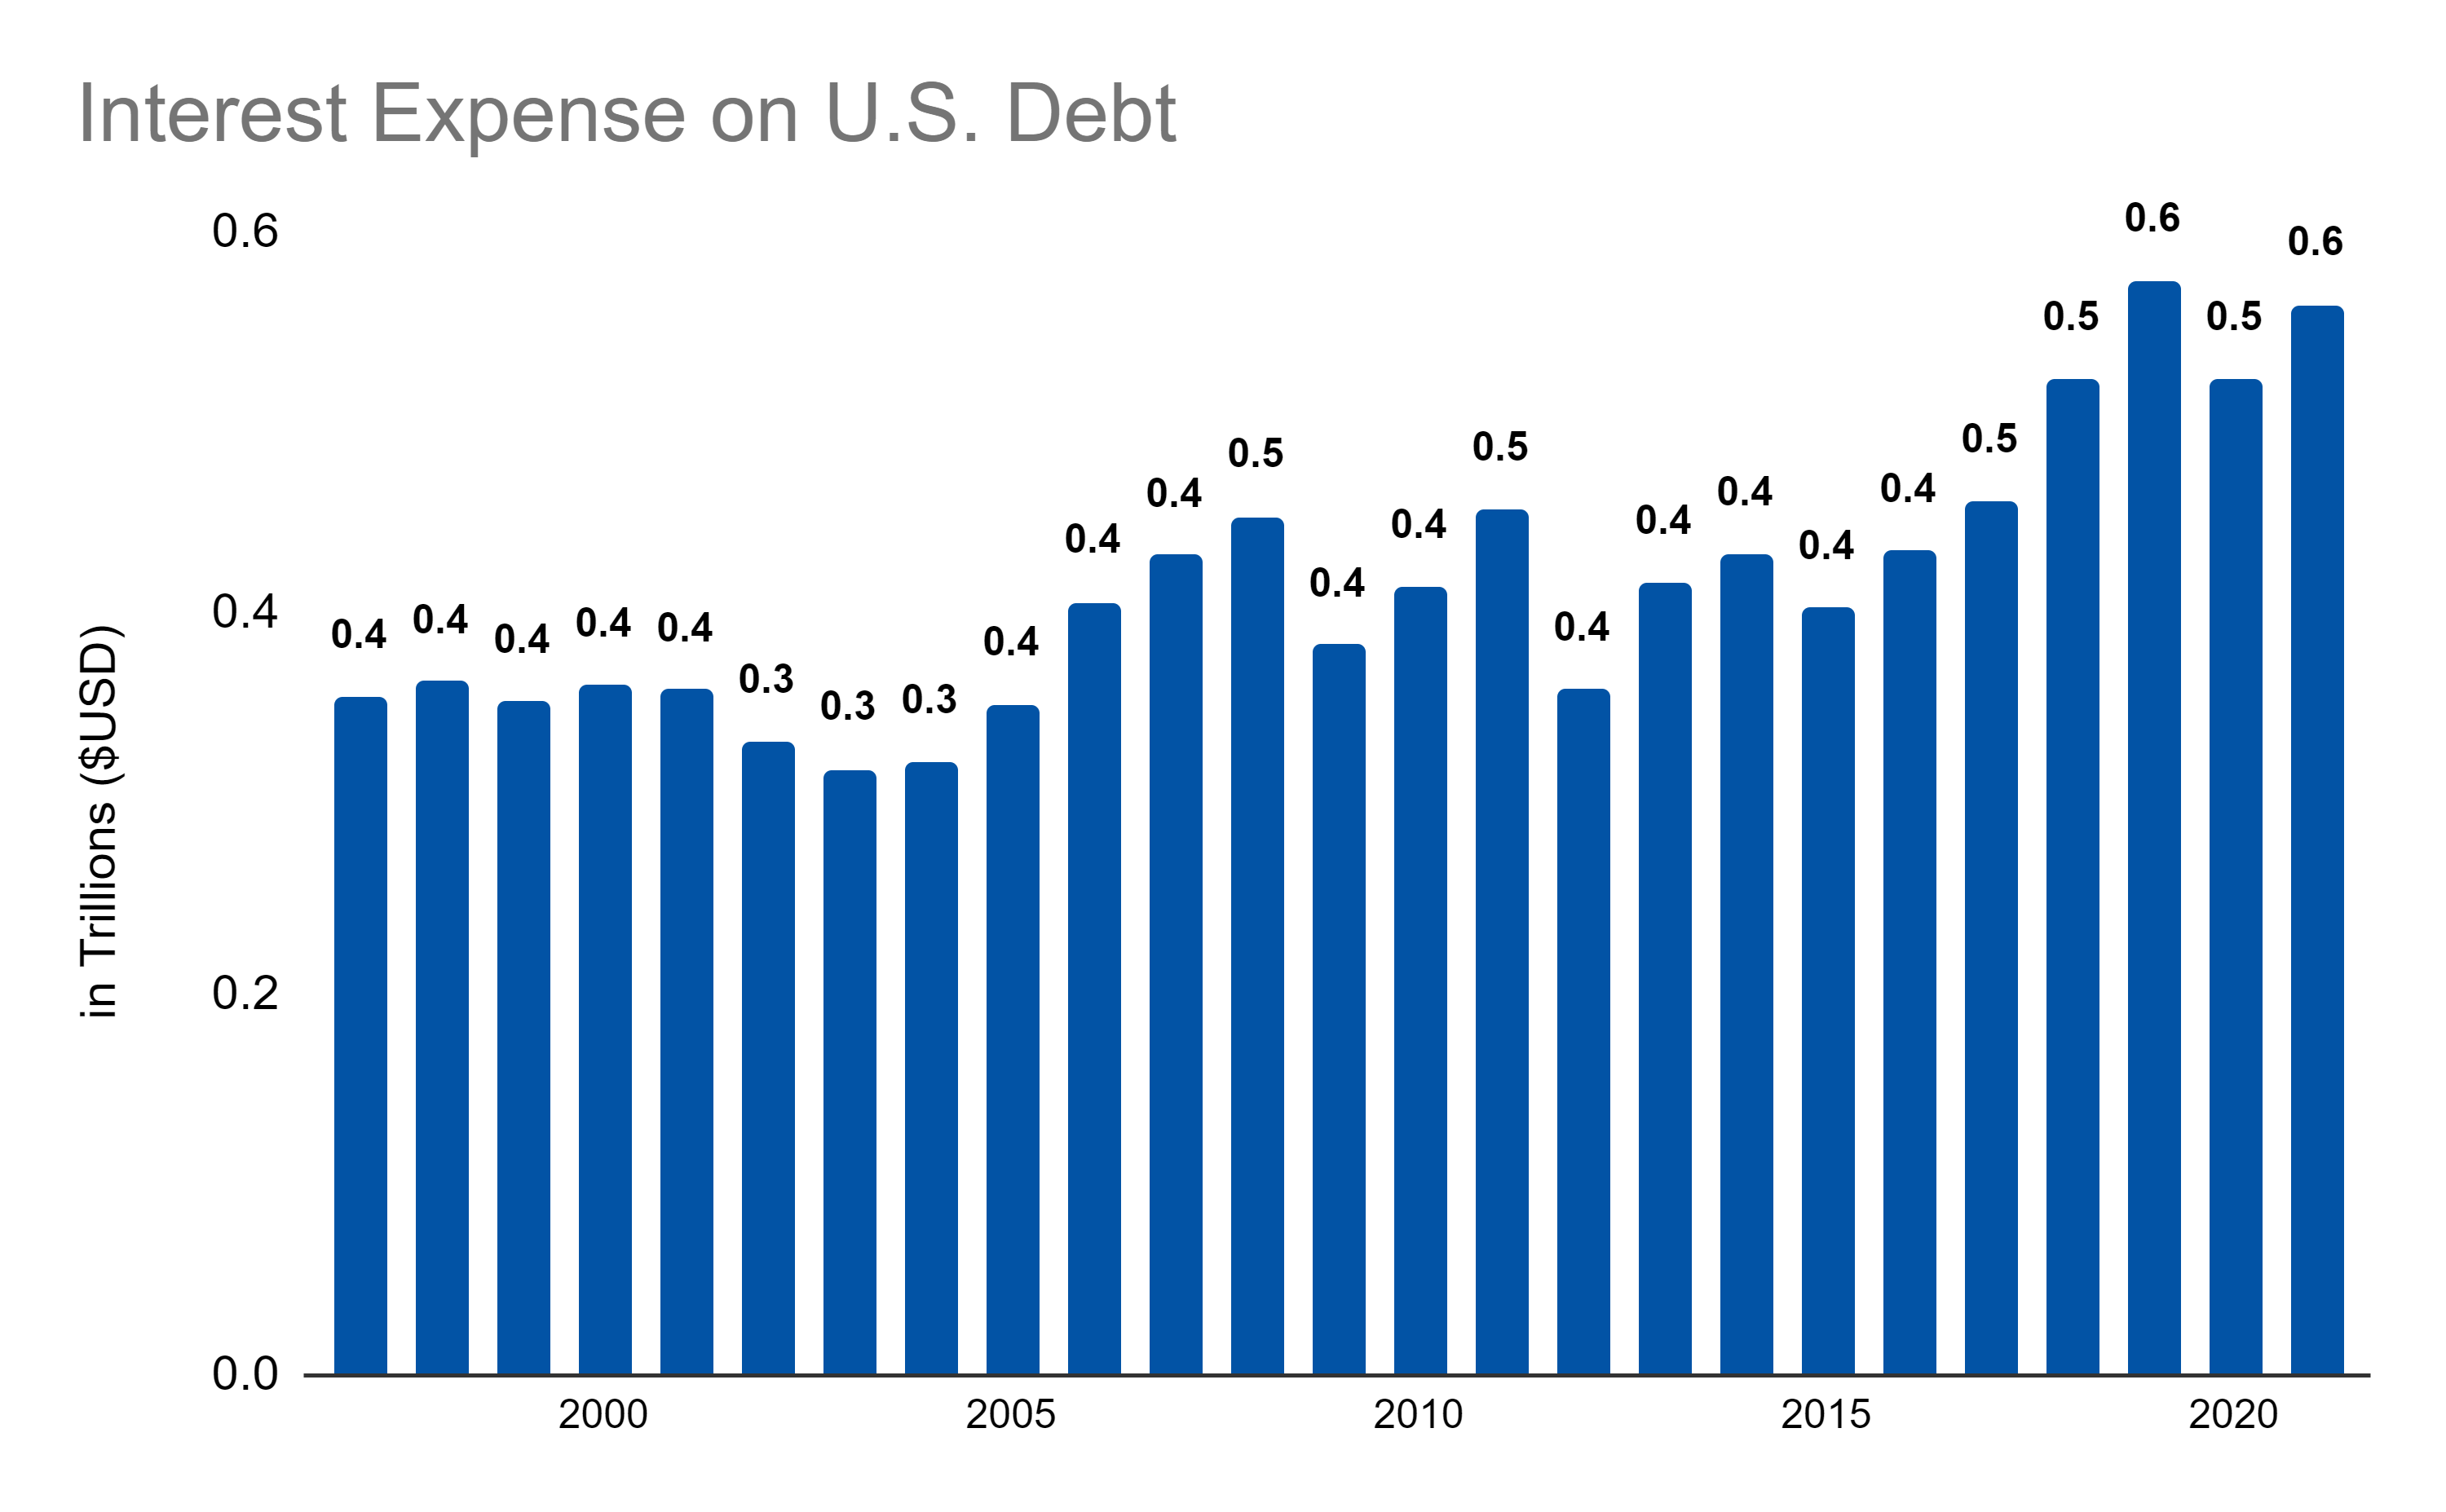
But, more importantly, how much the cost to service the U.S. debt has grown:
Debt relative to GDP increased dramatically following the Great Recession and also expanded during the recent COVID crisis. However, interest expense relative to GDP has fallen:
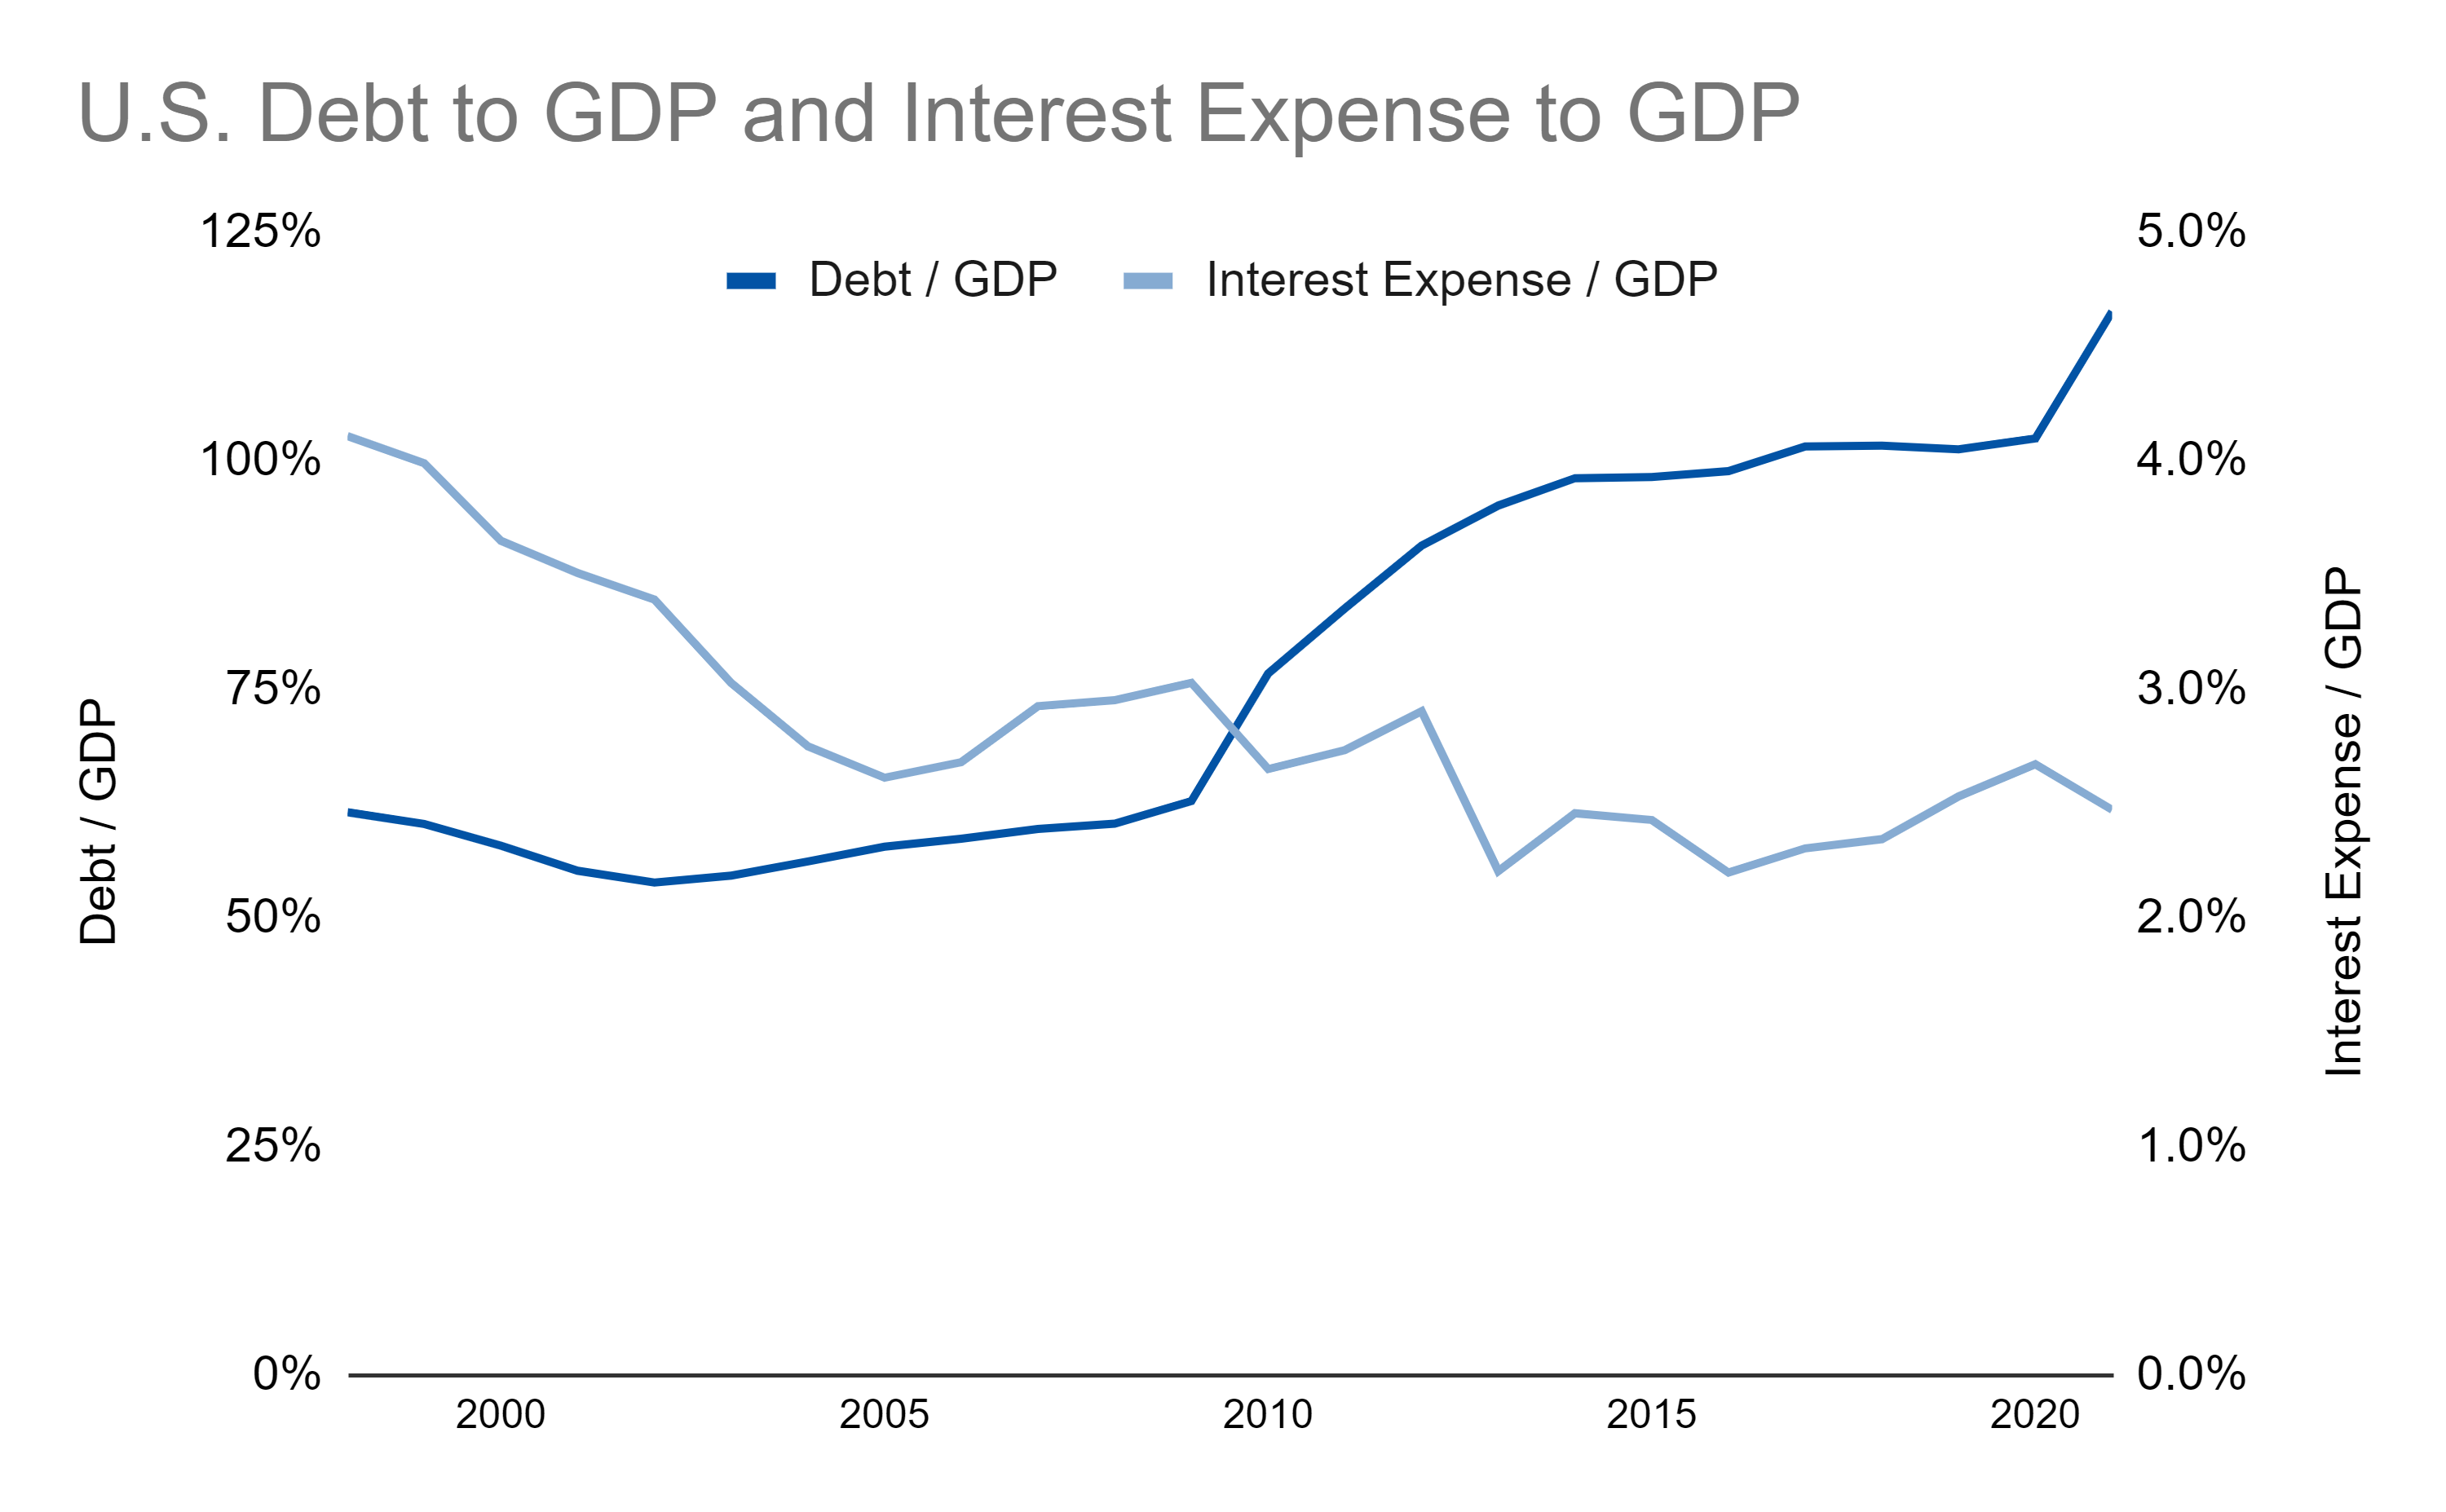
Another thing to consider is that interest ratios have come down as interest rates have come down:
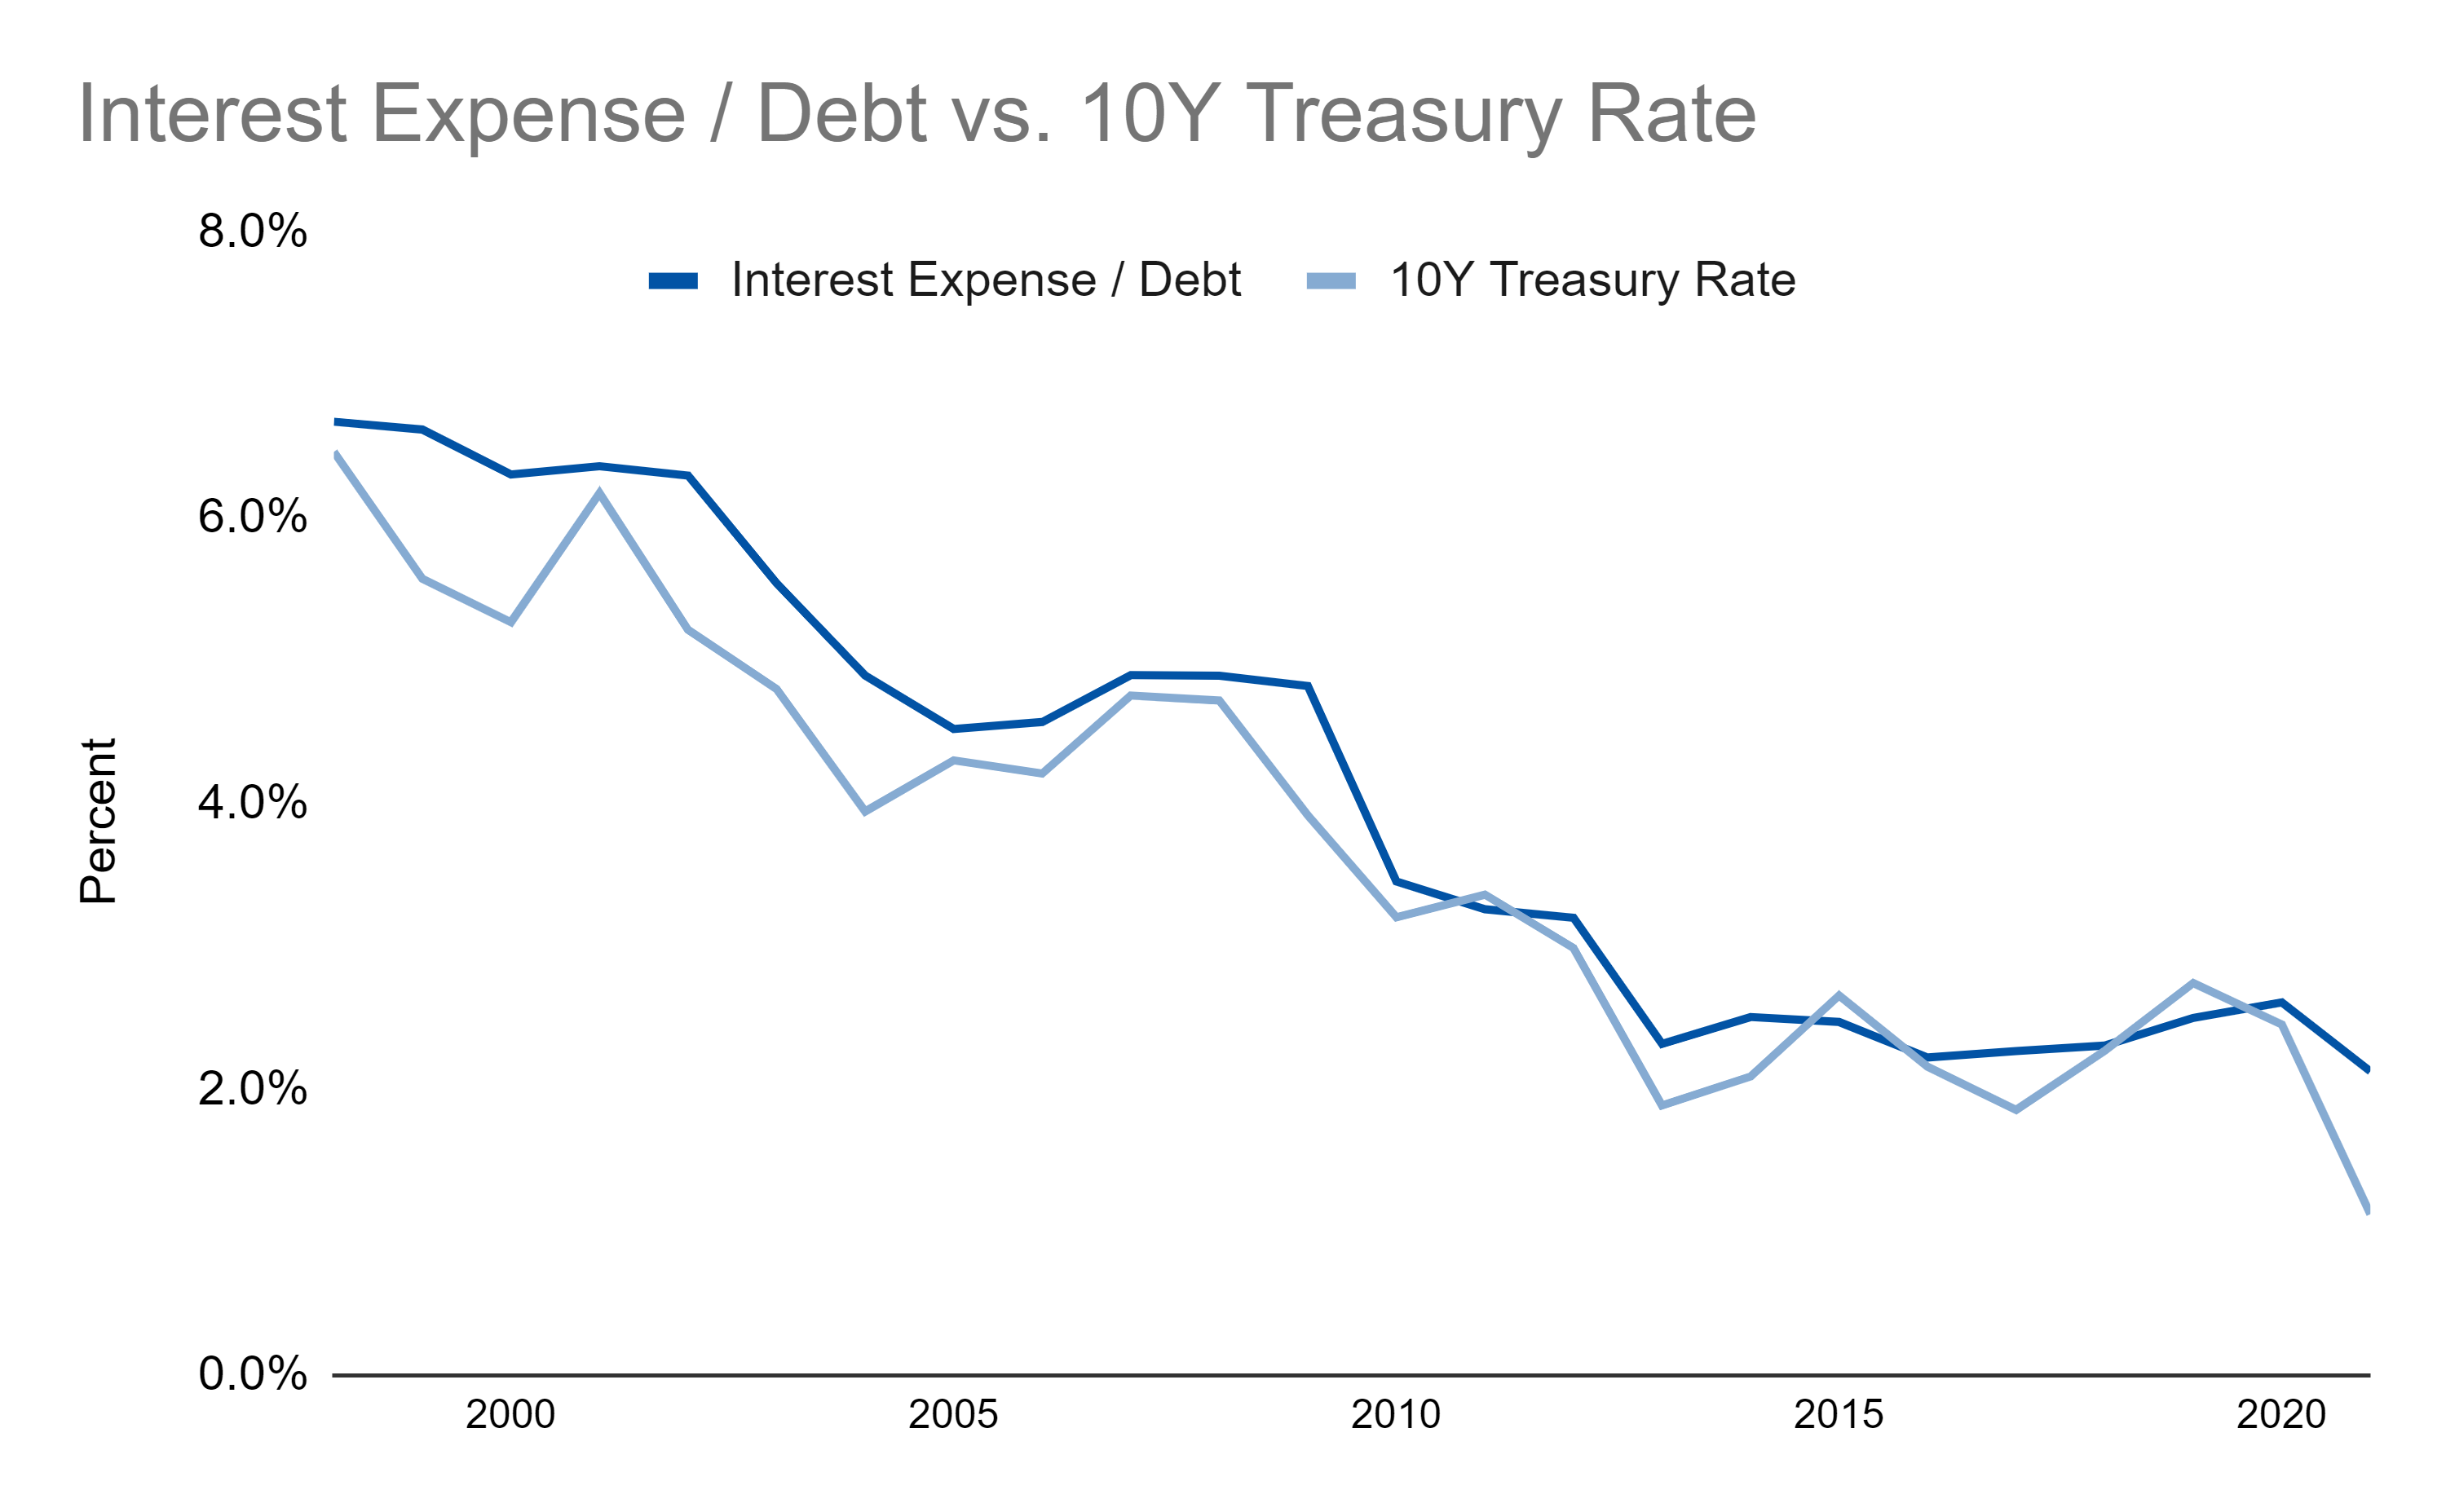
So, in a rising rate environment, that big pile of debt could become a lot more expensive to service. But, for now, while the nominal number is large, I’m not too concerned about U.S. debt as compared to some people out there!
Have a question you want to ask or a topic you’d like to see covered? Let me know!
Links
Most Popular Posts | All Historical Posts | Main Site | EM100 | EM1000
I like the chart that shows that the interest rate on the national debt roughly tracks the 10 year bond yield. Let's us know what chart to watch to track the interest rate of the national debt.
How about looking at interest payment as a percentage of total outlays? Right now, it is "low", around ~4.3% of total outlays. But, at what point do you think that number will become a problem? 10% ? 20%? With a projected jump in interest rates and a recent jump in the national debt (30 trillion), I suspect the percentage of total outlays will likely jump as well.