


Volatility and Rogue Waves
Unexpected big events
Yesterday, we looked at the S&P 500:

And, we saw that there can be large drawdowns in the S&P 500:

Another metric we can use to analyze these drawdowns in stressful periods is the CBOE Volatility Index (the VIX):

In addition to the VIX, which is calculated using a complicated methodology, we can use a very simple calculation (that I wrote about last year just prior the the COVID market crash in one of my personal favorite posts) to get a similar metric for stress that I’ll just call the “Rogue Wave Indicator” for fun:
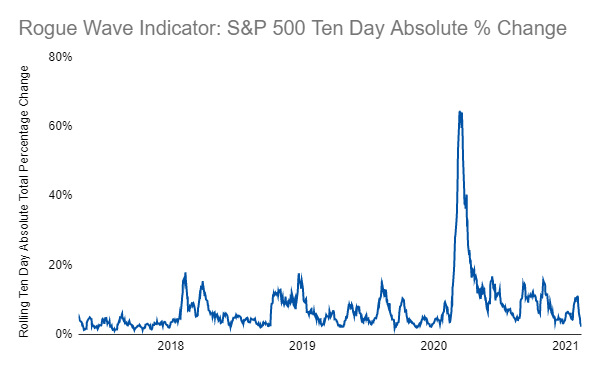
As I mentioned yesterday, I don’t know when the next stressful market event or rogue wave will hit us but, when it does, be sure to check out these metrics to see just how bad the situation is compared to what we’ve seen in the past!
Links
Yesterday’s Post | Most Popular Posts | All Historical Posts | Contact
Portfolios
Main Portfolio | Wild Stuff | Shiny Stuff | Safe Stuff | Big Stuff | Random Stuff
Live Charts
Tracking Portfolio Performance | “Wild Stuff” Constituents | “Shiny Stuff” Constituents | “Safe Stuff” Constituents | Ten-Year Treasury Less Two-Year Treasury | Ten-Year Breakeven Inflation Rate | S&P 500 | S&P Rolling All-Time High | S&P 500 Drawdown | Rogue Wave Indicator | CBOE Volatility Index (VIX) | Three-Month USD LIBOR | Three-Month Treasury Bill (Secondary Rate) | TED Spread