
Where does wealth come from?
A framework for real net worth
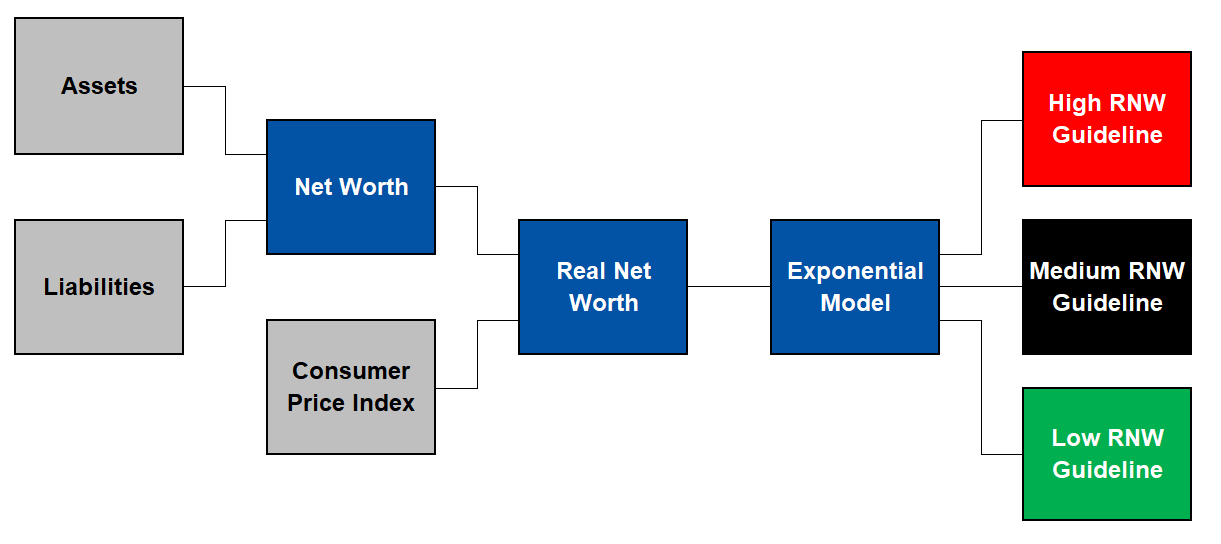
In the last two posts, we’ve been talking about real net worth. To build that metric, we took three inputs - assets, liabilities, and the consumer price index (for inflation):

Using just that metric, we were able to build an exponential model and create guidelines for when overall net worth may be running above or below trend:
And, here is what those guidelines look like versus actuals:

To further sophisticate our approach, it would be useful to understand where the inputs come from and if we can get further detail. Fortunately, we can - here is the breakdown of assets:

Liabilities are more simple:

Now, we have a much more complicated diagram to look at, with ten inputs, nine of which comprise wealth as measured by net worth:

With this more detailed framework, we have a lot more levers to adjust in the system. This is particularly useful for forecasting, which we will look at tomorrow.
Links
Most Popular Posts | All Historical Posts | Main Site | EM100 | EM1000 | Contact