
Amazon
Forward valuation metrics
We are now on version three of the daily stock highlight template! After starting off with Apple and Microsoft, we are up to over a dozen metrics now, so let’s check out Amazon:
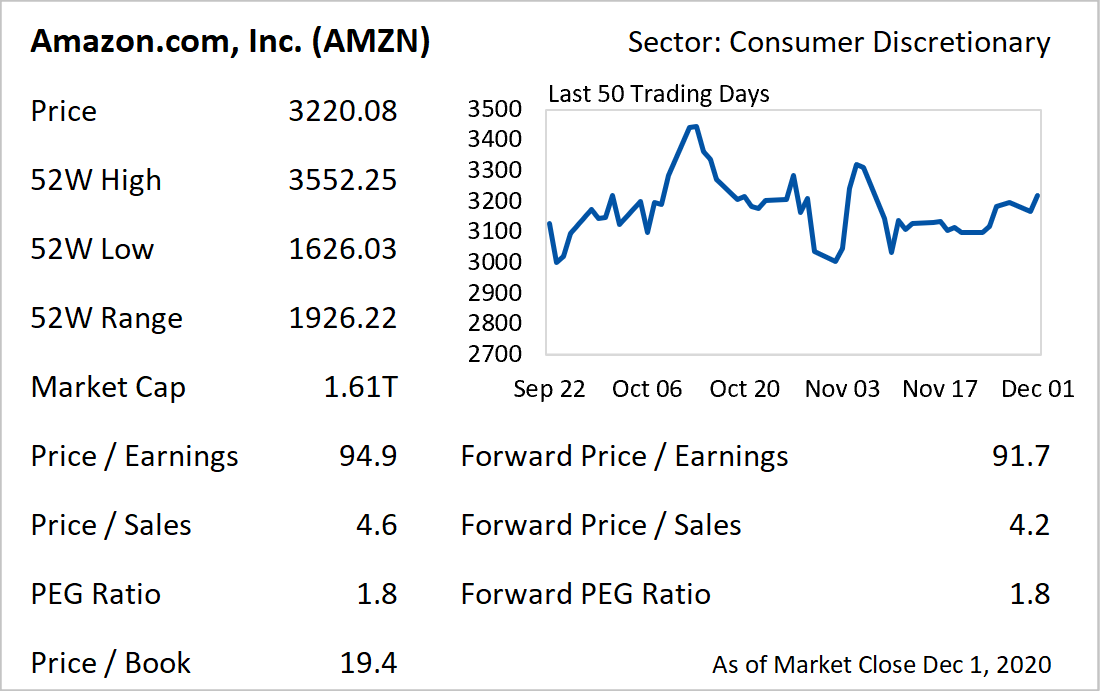
The first thing I did was move the as of date to the bottom right, since that’s not really top-line information, especially when this is part of a daily newsletter and you can expect the data date to be around the publication date. I replaced it with a sector identifier, which will be helpful when we eventually start considering peer analysis for these metrics.
The next thing I added was three forward-looking metrics for Price / Earnings, Price / Sales, and the PEG Ratio. The idea with forward metrics is that stocks are supposed to be forward looking, so historical ratios may not be as informative as future ones. Obviously, these forward-looking estimates are, therefore, an estimate. However, these three are commonly used in practice.
In this case, Amazon looks a tiny bit better on forward Price / Earnings and forward Price / Sales than the normal ratios calculated on the last twelve months. (Though, that may not be convincing enough if you need some definitive insight to make an investment decision.) Still, more metrics should be more helpful. And, tomorrow, we will add even more!