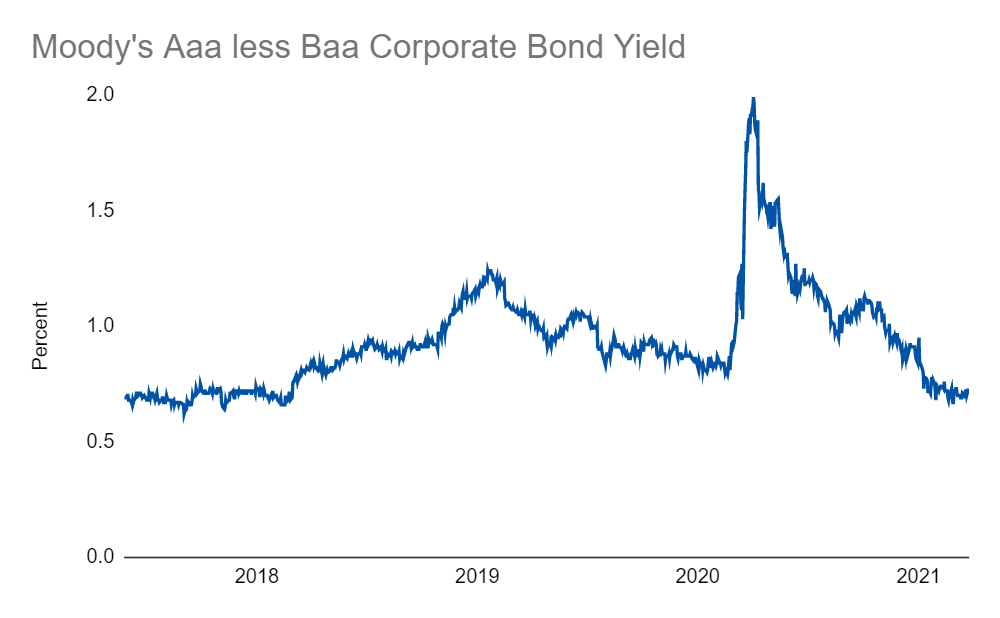
We’ve seen a lot of indicators for stress, such as bond yield spreads and the VIX:
There is another popular and useful metric for stress which takes a look at a different side of bond yields by using high yield (or non-investment grade) constituents instead of investment grade constituents. With this metric, the spread between poorly rated (i.e. riskier) bonds is compared to treasuries (i.e. less risky stuff). When things get stressful, people demand more yield for risky things, so the spread between these two things gets bigger. Here’s what that looks like:
This should look familiar to the other two charts. It’s yet another helpful way to assess the presence or absence of stress in the market. In March, things were stressful. But now, things are looking pretty good. And, that’s good for things overall - less stress is always a welcome development in my book!
Links
Yesterday’s Post | Most Popular Posts | All Historical Posts | Contact
Tracking Portfolios
Overall Comparison | Wild Stuff - Chart | Shiny Stuff - Chart | Safe Stuff - Chart | Big Stuff - Chart | Random Stuff - Chart
Live Charts
Ten-Year Treasury Less Two-Year Treasury | Ten-Year Breakeven Inflation Rate | S&P 500 | S&P Rolling All-Time High | S&P 500 Drawdown | S&P 500 Rogue Wave Indicator | S&P 500 Moving Averages | S&P 500 / 200-Day Moving Average | S&P 500 / 50-Day Moving Average | S&P 500 50-Day Moving Average / 200-Day Moving Average | S&P 500 Relative Strength Index | CBOE Volatility Index (VIX) | Three-Month USD LIBOR | Three-Month Treasury Bill (Secondary Rate) | TED Spread | Price of Bitcoin | Bitcoin Rolling All-Time High | Bitcoin Drawdown | Bitcoin Rogue Wave Indicator | Nasdaq Composite Index | Nasdaq Composite All-Time High | Nasdaq Composite Drawdown | Nasdaq Composite Wave Indicator | Nasdaq Composite Moving Averages | Nasdaq Composite / 200-Day Moving Average | Nasdaq Composite / 50-Day Moving Average | Nasdaq Composite 50-Day Moving Average / 200-Day Moving Average | Nasdaq Composite Relative Strength Index | Moody's Seasoned Aaa Corporate Bond Yield | Moody's Seasoned Baa Corporate Bond Yield | Moody’s Aaa less Baa Corporate Bond Yield | Dow Jones Industrial Average | Dow Jones Transportation Average | Dow Jones Industrial Average / Transportation Average


