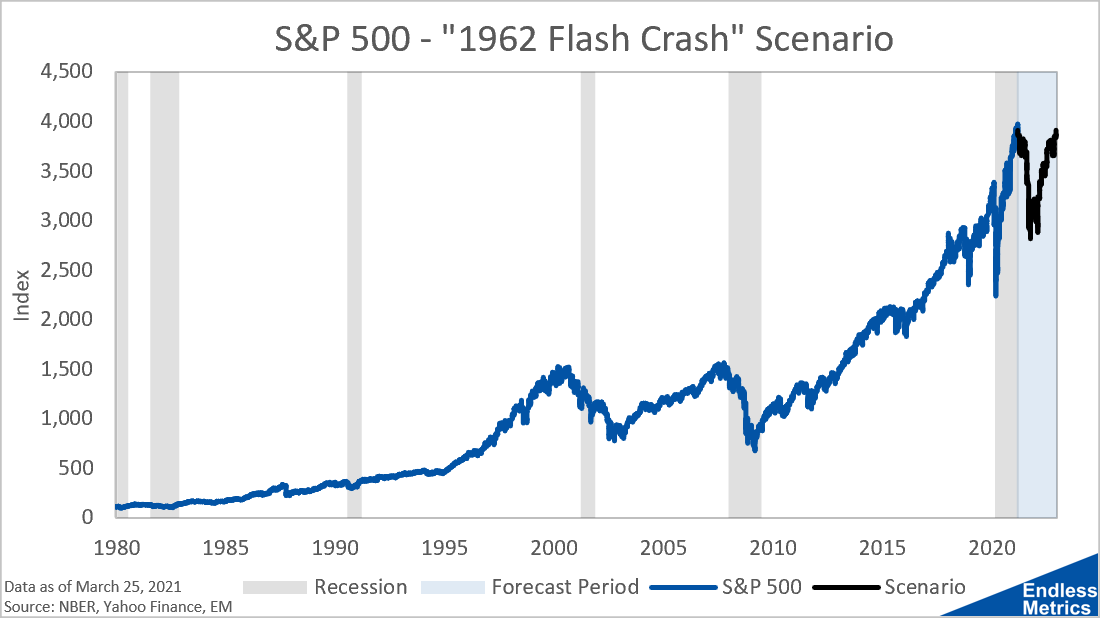
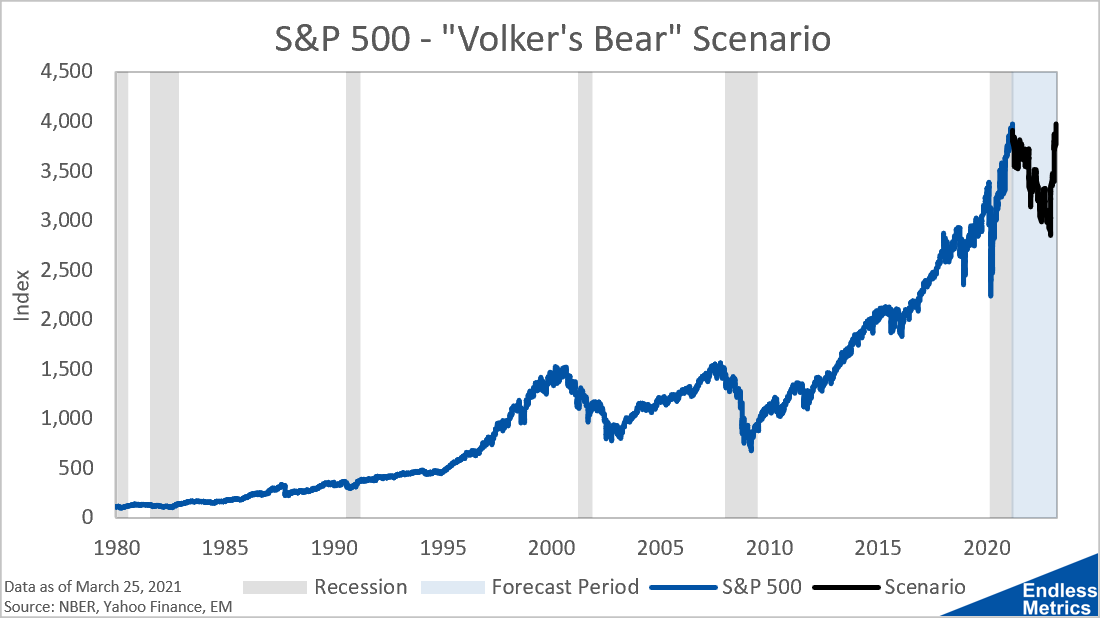
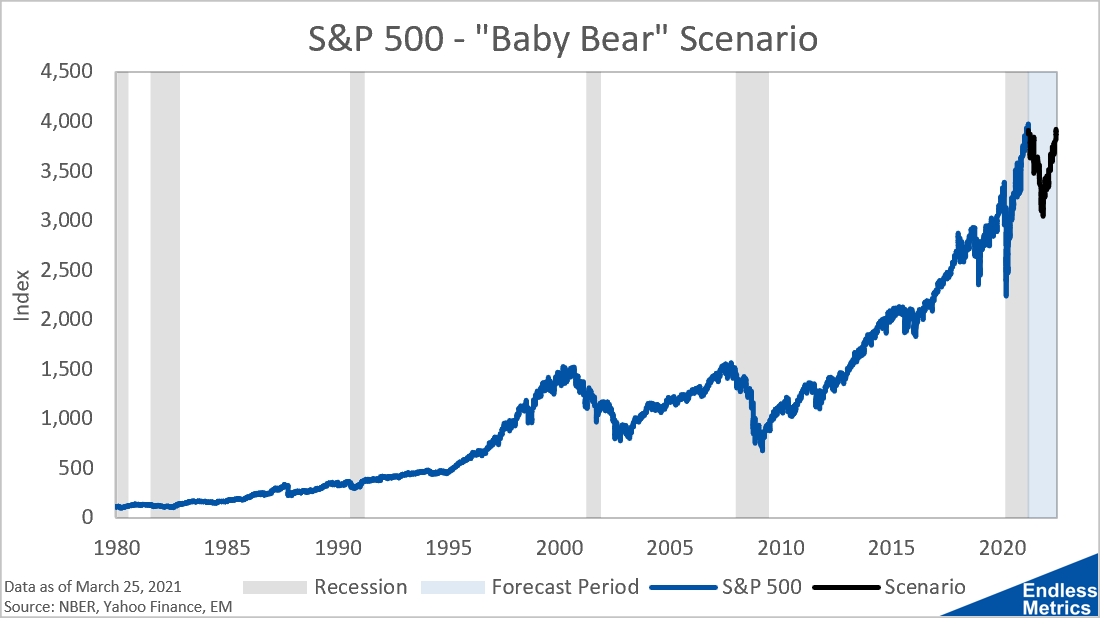
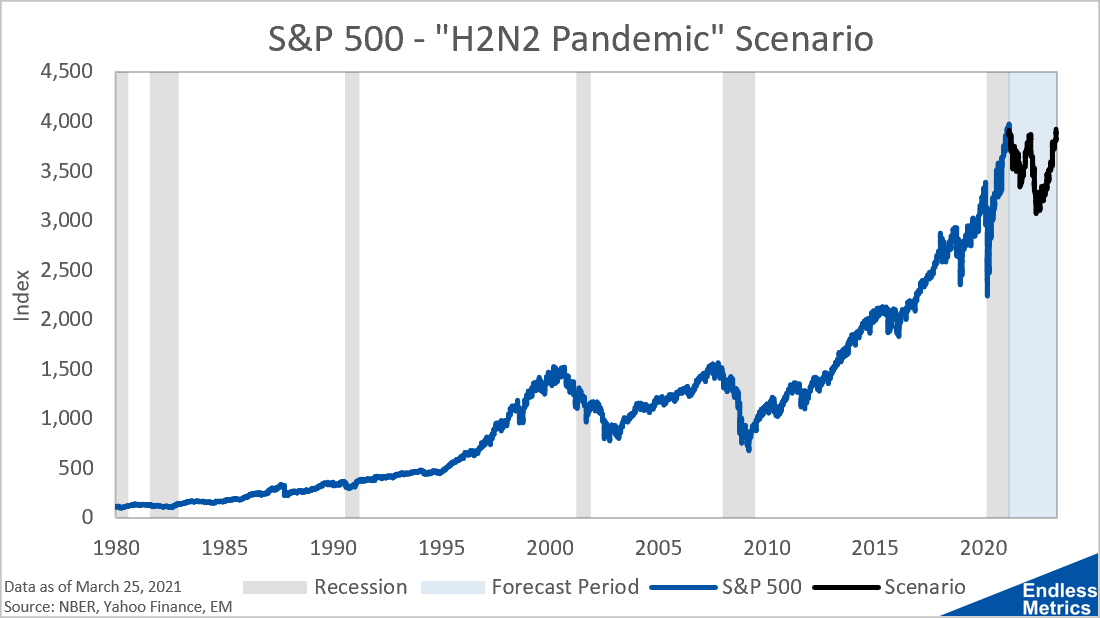
Seven More Bear Markets
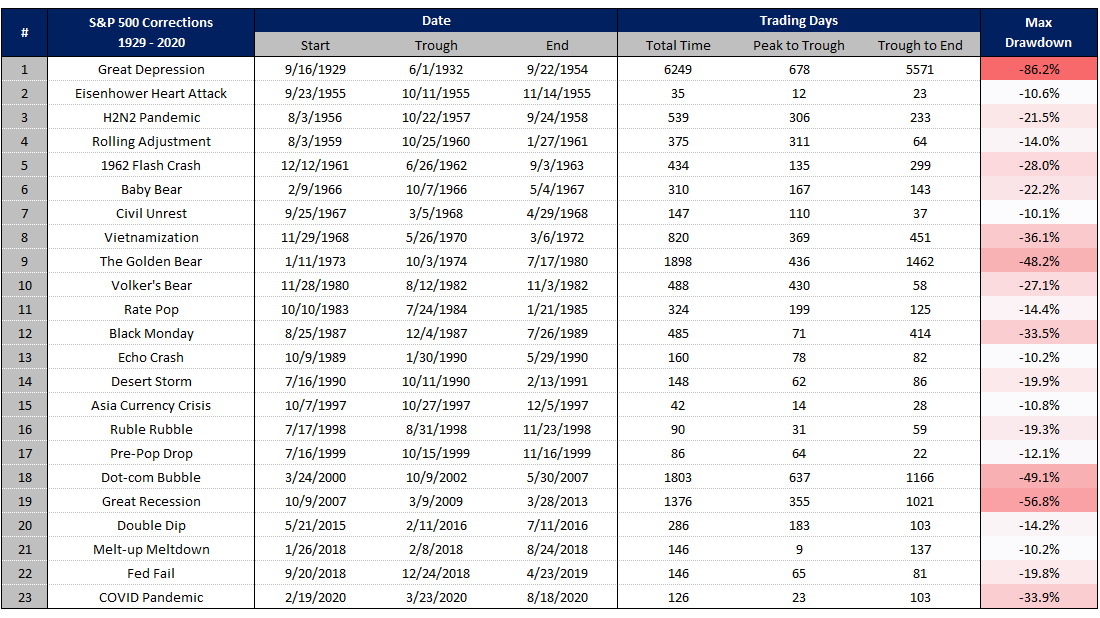
Over the last two days, I covered the Great Depression along with the Great Recession, Dot-com Bubble, and COVID crash. However, there are still a ton of other bad market events to look at:
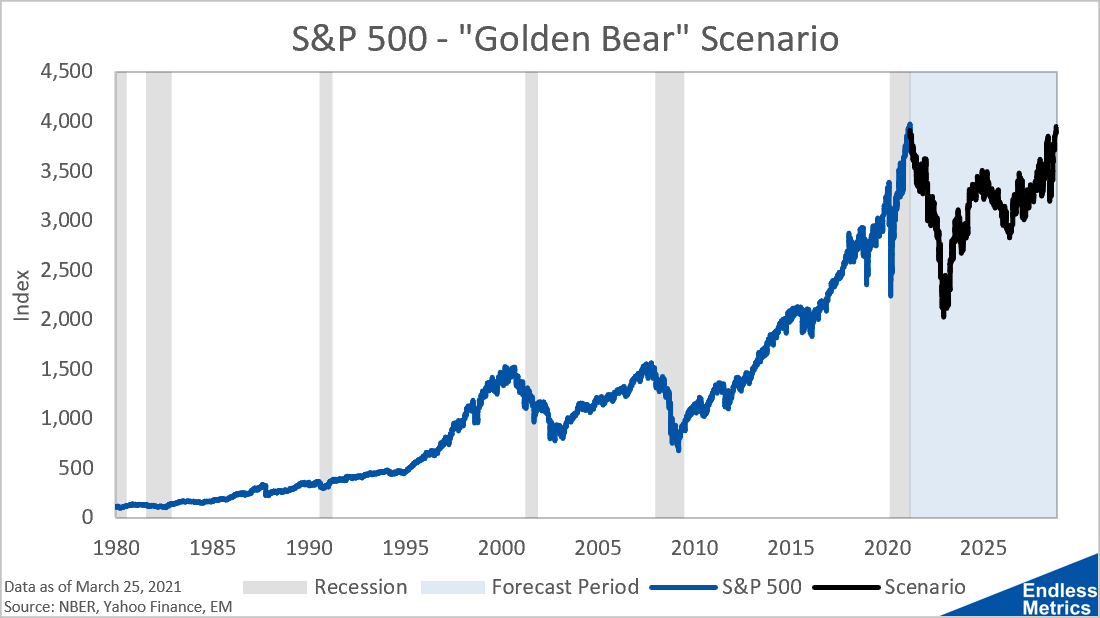
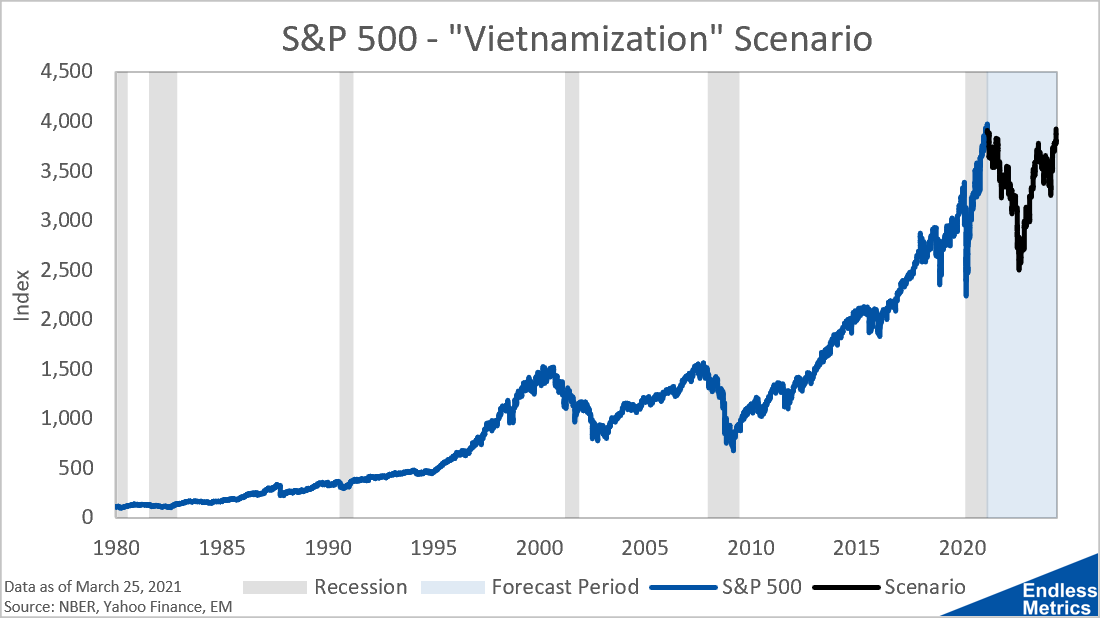
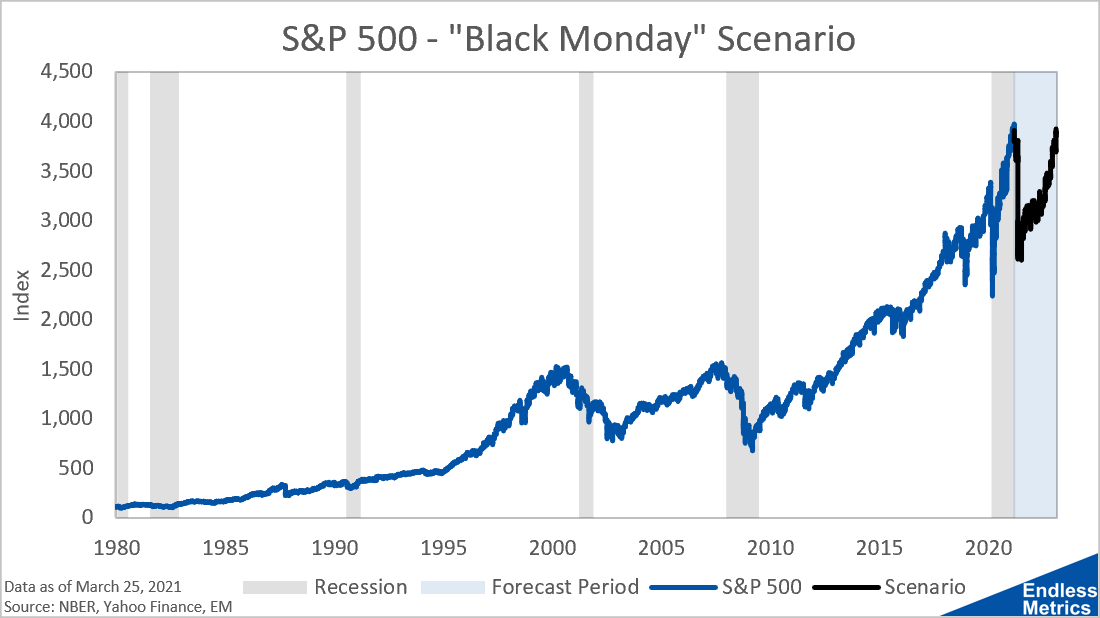
Besides the four downturns I already mentioned, there are seven other bear markets of at least a -20% drop since 1929. So, here’s a visual history of how they looked from the context of if they happened again:
Links
Yesterday’s Post | Most Popular Posts | All Historical Posts | Contact
Tracking Portfolios
Overall Comparison | Wild Stuff - Chart | Shiny Stuff - Chart | Safe Stuff - Chart | Big Stuff - Chart | Random Stuff - Chart
Live Charts
Ten-Year Treasury Less Two-Year Treasury | Ten-Year Breakeven Inflation Rate | S&P 500 | S&P Rolling All-Time High | S&P 500 Drawdown | S&P 500 Rogue Wave Indicator | S&P 500 Moving Averages | S&P 500 / 200-Day Moving Average | S&P 500 / 50-Day Moving Average | S&P 500 50-Day Moving Average / 200-Day Moving Average | S&P 500 Relative Strength Index | CBOE Volatility Index (VIX) | Three-Month USD LIBOR | Three-Month Treasury Bill (Secondary Rate) | TED Spread | Price of Bitcoin | Bitcoin Rolling All-Time High | Bitcoin Drawdown | Bitcoin Rogue Wave Indicator | Nasdaq Composite Index | Nasdaq Composite All-Time High | Nasdaq Composite Drawdown | Nasdaq Composite Wave Indicator | Nasdaq Composite Moving Averages | Nasdaq Composite / 200-Day Moving Average | Nasdaq Composite / 50-Day Moving Average | Nasdaq Composite 50-Day Moving Average / 200-Day Moving Average | Nasdaq Composite Relative Strength Index


